Stroke is one of the leading cause of morbidity and mortality worldwide, with significant long-term disability. Micronutrients, including vitamins, influence immune regulation and behaviour, potentially affecting stroke risk [1, 2]. For instance, low serum vitamin D levels have been associated with poorer post-stroke outcomes [3], although supplementation trials indicate no impact on daily living activities post stroke [4]. These inconsistencies may arise from variations in study design, endpoints, population characteristics, and confounding factors, underscoring the need for robust methodologies like Mendelian randomisation (MR) to establish causal relationships between micronutrient levels and stroke risk. Unlike observational studies, which identify correlations, MR leverages genetic variants as instrumental variables to reduce confounding and reverse causation, providing stronger evidence for causality [5].
We hypothesise that genetically determined levels of specific micronutrients, particularly plasma vitamin B6 (VB6), have a causal relationship with stroke risk. This study employs MR to explore these associations and validates the findings using National Health and Nutrition Examination Survey (NHANES) data, with the aim of informing targeted stroke prevention strategies.
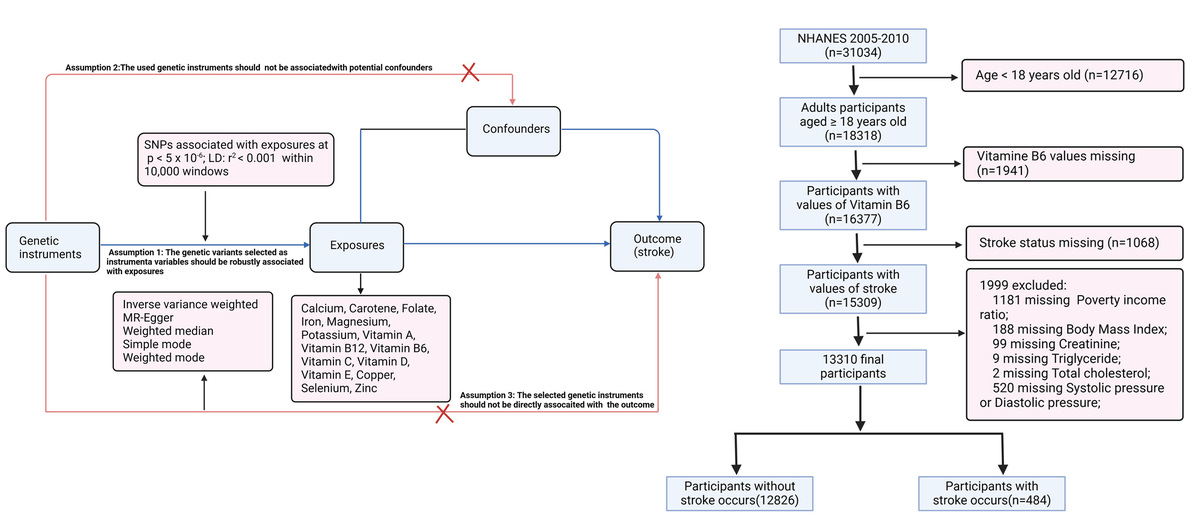
Methods. Data source of MR analysis. Summary-level stroke data were obtained from FinnGen R10, including 340,999 individuals of European ancestry (43,132 stroke cases and 297,867 controls; https://www.finngen.fi/en). Genetic instruments were selected from GWAS data on 15 micronutrients available in the IEU OpenGWAS database: copper (ieu-a-1073), selenium (ieu-a-1077), zinc (ieu-a-1079), folate (ukb-b-11349), carotene (ukb-b-16202), potassium (ukb-b-17881), vitamin D (ukb-b-18593), vitamin C (ukb-b-19390), vitamin B12 (ukb-b-19524), iron (ukb-b-20447), vitamin E (ukb-b-6888), magnesium (ukb-b-7372), vitamin B6 (VB6, ukb-b-7864), calcium (ukb-b-8951), and vitamin A (ukb-b-9596). To enhance visual comprehension, a flowchart of the research is included in Supplementary Figure S1.
NHANES cross-sectional analysis. For the cross-sectional study, we used NHANES data from 2005 to 2010. Stroke status was determined based on affirmative responses to “Has a doctor or other health professional ever told you that you had a stroke?” Plasma VB6 levels were measured via reversed-phase HPLC with fluorometric detection. A total of 13,310 participants over age 18 years were included after excluding those with missing data on VB6, stroke, or key covariates. Sensitivity analyses indicated that excluding participants with missing covariates did not bias the observed associations.
Statistical analysis. Single nucleotide polymorphism (SNPs) with genome-wide significant associations with micronutrient levels, independent of stroke and other confounders, were selected as instrumental variables (p < 5 × 10⁻⁶), and aggregated based on linkage disequilibrium (R2 < 0.001 within a 10,000 kb window). Additionally, to minimise confounding, we used the PhenoScanner database to exclude SNPs associated with other potential influences on the outcome. Our primary MR analysis was conducted using the random-effects inverse variance weighted (IVW) method, chosen for its higher statistical power [6]. To ensure robustness, we supplemented this with MR-Egger and weighted median methods, which offer protection against pleiotropic effects despite generally lower power than IVW. Heterogeneity was evaluated with Cochran’s Q test (p < 0.05 indicating presence).
The influence of individual SNPs was examined using leave-one-out analysis, and the MR-PRESSO method was employed to detect and correct for pleiotropic outliers. MR-Egger regression intercepts were used to evaluate bias from directional pleiotropy. F-statistics were calculated for each instrumental variable set, with a threshold of F > 10 applied to reduce weak instrument bias and strengthen confidence in instrument validity.
In the NHANES analysis, continuous variables were expressed as mean ± SD and compared using one-way ANOVA, while categorical variables were presented as counts and percentages, analysed by χ2 tests. Participants were divided into tertiles based on VB6 levels to provide balanced groups for robust statistical power and to capture variation across VB6 levels. A weighted multivariable logistic regression model assessed the association between VB6 tertiles and stroke risk, using the first tertile as reference, with adjustments across 3 models (Model 1: unadjusted; Model 2: adjusted for demographic factors; Model 3: fully adjusted). Variance inflation factors (VIF)s were checked to prevent multicollinearity, ensuring all included covariates had acceptable VIF values (< 5).
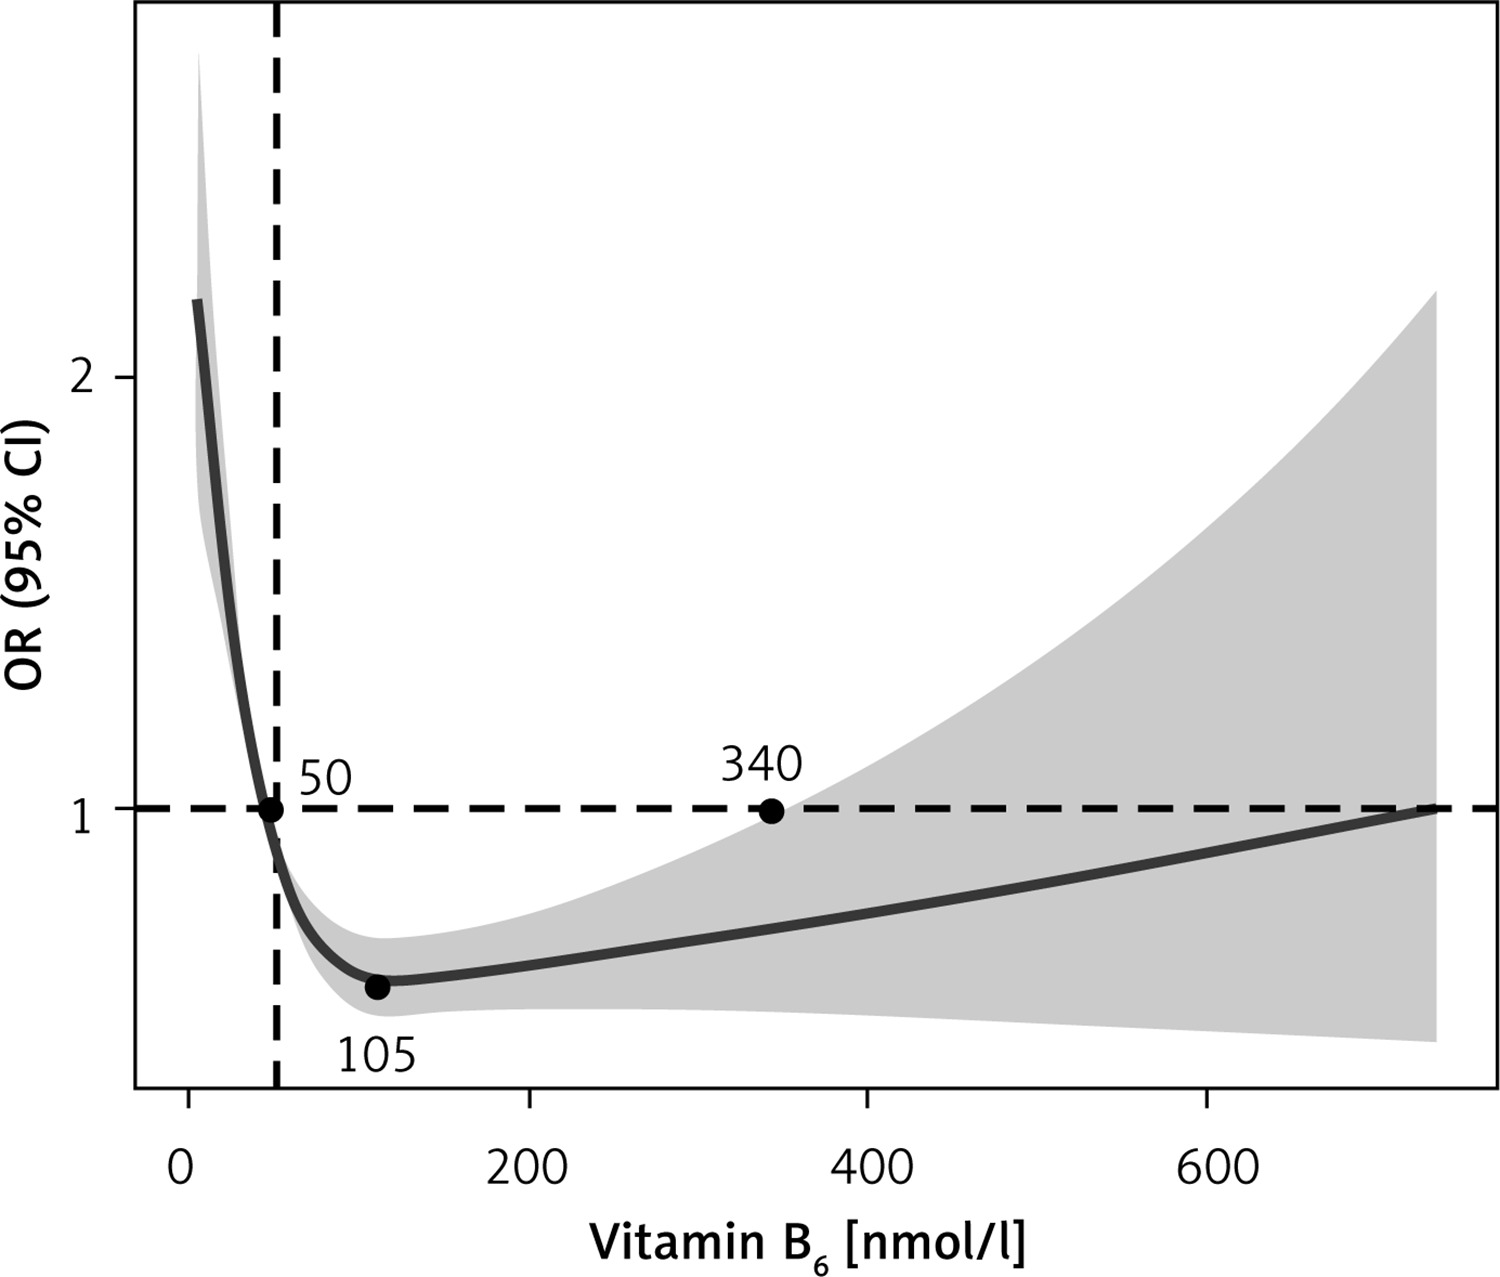
We also used a weighted restricted cubic spline model in the rms package in R to evaluate the non-linear association between VB6 levels and stroke risk (Figure 1). The survey-weighted framework adjusted for complex sampling, with knots at key quantiles to capture changes in the dose-response relationship. Results were presented as odds ratios with 95% confidence intervals to illustrate the risk variation across different levels of VB6. Statistical analyses were performed using R version 4.3.2, with a two-sided p-value < 0.05 considered significant.
Figure 1
Weighted restrictive cubic spline between VB6 and stroke
CI – confidence interval, OR – odds ratio.
Results. Causal association between micronutrients and stroke in MR analysis. A total of 179 SNPs associated with 15 circulating micronutrients were identified as instrumental variables (Supplementary Table SI). Only VB6 levels showed a significant negative association with stroke risk using the IVW method, with a one-standard deviation increase in VB6 associated with a 22.8% reduction in stroke risk (Table I). We also conducted sensitivity analyses using the weighted median method, which confirmed the robustness of the results in the presence of potentially invalid instruments (Supplementary Table SI). Significant heterogeneity was observed for potassium and folate, prompting the use of a random-effects IVW model. The MR-PRESSO analysis detected no significant pleiotropic outliers (Table I), and the Egger intercept indicated no directional pleiotropy. Leave-one-out tests further suggested that no single SNP disproportionately influenced the results (Supplementary Figure S2).
Table I
Associations between genetically predicted micronutrient levels and stroke risk using IVW Mendelian randomisation analysis
[i] Heterogeneity was evaluated with Cochran’s Q test (p < 0.05 indicating presence), Pleiotropy was assessed using MR-Egger regression intercepts, and the MR-PRESSO Global Test was applied to detect and correct for pleiotropic outliers. CI – confidence interval, IVW – inverse-variance weighted, MR – Mendelian randomisation, MR-PRESSO – Mendelian randomisation pleiotropy residual sum and outlier, OR – odds ratio, SNPs – single nucleotide polymorphisms.
Association between VB6 and stroke in NHANES. In the NHANES analysis of 13,310 participants, the stroke prevalence was 5.5%, 2.8%, and 2.7% across VB6 tertiles 1, 2, and 3, respectively. Lower VB6 levels were associated with higher comorbidity rates, including hypertension, diabetes, smoking, and lower HDL levels (Supplementary Table SII). Weighted logistic regression revealed a significantly reduced stroke risk in the middle VB6 tertile compared to the lowest, in both Models 2 and 3. Although the highest tertile suggested a further reduced risk (Model 2), this association was not statistically significant after adjusting for covariates in Model 3. Additionally, weighted restricted cubic spline modelling suggested a U-shaped relationship between VB6 levels and stroke risk, with VB6 levels between 50 and 340 nmol/l associated with the lowest stroke risk, and both low and high levels outside this range associated with an increased risk (Table II, Figure 1).
Table II
Weighted logistic regression analysis on the association between vitamin B6 tertiles and stroke
| Vitamin B6 | Total number | Number of cases (%) | Model 1 Odds ratio (95% confidence interval) | Model 2 Odds ratio (95% confidence interval) | Model 3 Odds ratio (95% confidence interval) |
|---|---|---|---|---|---|
| Tertile 1 | 4390 | 240 (5.47) | Reference | Reference | Reference |
| Tertile 2 | 4458 | 124 (2.78) | 0.46 (0.36–0.61)*** | 0.65 (0.50–0.83)** | 0.65 (0.43–0.98)* |
| Tertile 3 | 4462 | 120 (2.69) | 0.43 (0.30–0.64)*** | 0.54 (0.3–-0.79)** | 0.64 (0.35–1.18) |
Model 1 was unadjusted; Model 2 was adjusted for age, sex, race, body mass index, educational level, current smoking status; and Model 3 was further adjusted for married/live with partner status, poverty income ratio, physical activity, fasting glucose, creatinine, systolic blood pressure, diastolic blood pressure, low density lipoprotein, high-density lipoprotein, self-reported diabetes, self-reported hypertension, self-reported hyperlipidaemia, antihydiabetes treatment, antihypertensive treatment, and lipoprotein-lowering treatment.
Discussion. Stroke patients often exhibit low plasma VB6 levels [1], and vitamin B intake has been associated with reduced stroke risk [7–9]. However, long-term prospective studies spanning over 13 years have failed to establish a significant association between dietary VB6 intake and ischaemic or haemorrhagic stroke risk [10]. Using MR to minimise confounding, our study is the first to establish a direct causal link between plasma VB6 levels and stroke risk. Further analysis of NHANES data revealed a U-shaped association, indicating that the optimal plasma VB6 range (50–340 nmol/l) is associated with the lowest stroke risk.
While Zhang et al. analysed NHANES data from 2003–2006 and found an L-shaped association in 8327 participants [11], our study extends this by examining a larger cohort of 13,310 participants from 2005 to 2010. Importantly, the U-shaped relationship in our study suggests that both low and high plasma VB6 levels may increase stroke risk, aligning with the dual biological role of VB6 at extreme concentrations. By integrating MR approach and validating findings with NHANES data, our study further strengthens causal inference and enhances the robustness of these results, thus providing valuable insights for public health strategies.
The protective effects of VB6 in reducing stroke risk are well-supported biologically. Firstly, VB6 serves as a cofactor in the conversion of homocysteine to methionine and cysteine, key compounds that support antioxidant defences and reduce vascular inflammation. Deficiency in VB6 disrupts this process, leading to elevated homocysteine levels, which damage blood vessels, and a reduction in methionine and cysteine, weakening antioxidant defences and promoting cytokine production [12, 13]. Second, VB6 is involved in nitric oxide synthesis, a critical vasodilator for maintaining neurovascular health. A deficiency in VB6 reduces nitric oxide bioavailability, impairing vasodilation and promoting thrombosis [12]. Finally, VB6 is essential for the synthesis of neurotransmitters such as serotonin and dopamine, which are vital for cerebral blood flow and neuronal health. Deficiency in VB6 disrupts these pathways, potentially increasing susceptibility to stroke [14]. However, at higher plasma concentrations, VB6 may have neurotoxic effects [15], with cases of peripheral neuropathy reported at doses as low as 6 mg/day over prolonged periods, resulting in serum levels around 259.9 nmol/l [16]. Excessive VB6 may also induce pro-oxidative effects, potentially causing endothelial dysfunction, a known stroke risk factor [17]. This dual action – protective at moderate levels but harmful at higher ones – could explain the U-shaped relationship in our study, where levels above 340 nmol/l were associated with increased stroke risk. Further research is needed to clarify this association and to establish safe VB6 limits.
Our study has several limitations. First, the absence of stroke subtype data in the NHANES and FinnGen datasets restricts our ability to assess the impact of stroke subtypes on the results. Future studies with subtype-specific data are needed to address this gap. Second, the use of self-reported stroke data in NHANES introduces potential recall bias, which may affect the accuracy of stroke classification and influence the observed association between VB6 levels and stroke risk. This emphasises the need for cautious interpretation. Future studies should incorporate objective clinical data to validate these findings. Finally, because the genetic data were derived from the FinnGen cohort, the generalisability of our findings may be limited to European populations. Future research should include more diverse populations to improve applicability.
In conclusion, our study suggests that routine VB6 screening could benefit individuals at high risk for stroke, although further research is needed to establish clinical thresholds. Integrating VB6 screening with follow-up protocols for low levels may offer a targeted intervention strategy for stroke prevention.