Introduction
Myocardial ischemia (MI)/reperfusion injury (RI) is a major cardiovascular disease induced by myocardial ultrastructural damage during the reperfusion process and leads to various adverse cardiovascular outcomes and risk factors worldwide [1, 2]. Currently, there is a widespread consensus among researchers that MI/RI is complicated by a diverse range of pathophysiological processes and molecular factors, such as inflammation, apoptosis, metabolic disorders, pyroptosis, and autophagy [3]. However, current prevention and treatment regimens for MI/RI disease are still limited; moreover, the prognosis outcome of MI/RI patients is far from satisfactory [4]. Therefore, it is essential to clarify the precise regulatory mechanisms underlying MI/RI pathogenesis for the research and development of more innovative and effective therapeutic strategies.
Ferroptosis is a nonapoptotic type of necrotic programmed cell death that is characterized by excessive amounts of iron- and oxidation-dependent reactive oxygen species (ROS) and toxic lipid peroxidation [5]. Observations from preclinical research have indicated that the occurrence and development of ferroptosis are implicated in diverse human disorders, including cardiovascular diseases, especially in some types of cancer [6–14]. Many researchers have further proposed that abnormal or dysregulated ferroptosis also induces MI/RI pathogenesis [15–18]. Interestingly, according to Liu et al., core transcription factors, such as activating transcription factor 3 (ATF3), have been identified as hub genes associated with ferroptosis in acute myocardial infarction (AMI) [19, 20]; however, they have not been reported in MI/RI. Therefore, elucidating the specific regulatory mechanisms underlying ferroptosis-associated cardiovascular disease is essential for attenuating MI/RI through the identification of novel and effective therapeutic targets.
Circular RNAs (circRNAs) are endogenous noncoding RNAs (ncRNAs) generated from transcriptional back-splicing events that function extensively as essential or key regulators in multiple human diseases and cancers [21–24]. Intriguingly, some investigations have revealed that the molecular mechanisms of disease- or cancer-induced ferroptosis are strongly implicated in ceRNA regulation [25–29]. However, the precise and detailed molecular functions of circRNAs in the ferroptosis process under MI/RI conditions have not been fully elucidated.
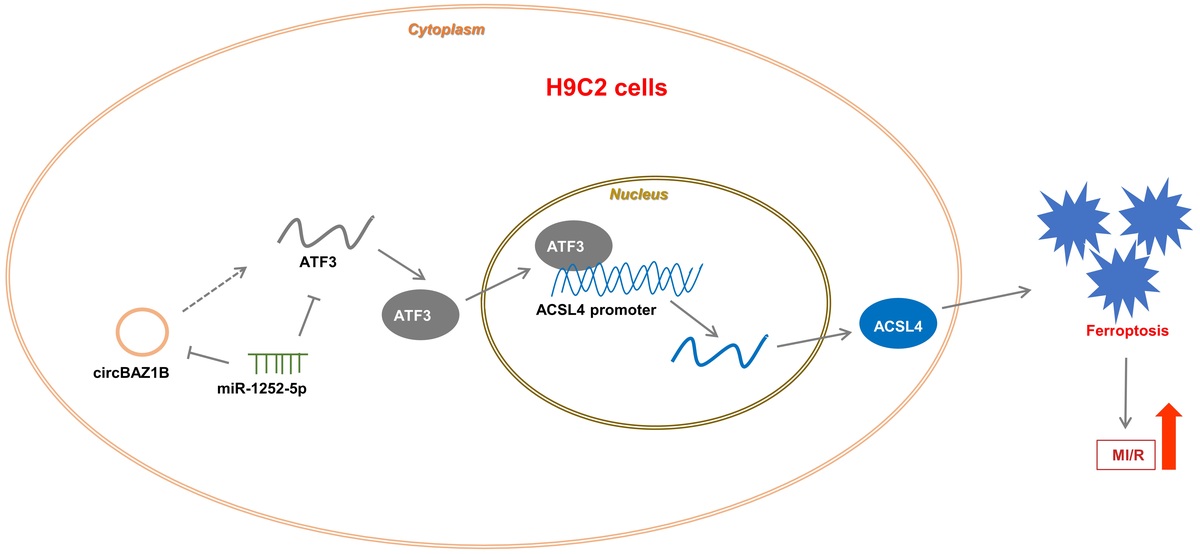
Therefore, in this study we focused on the molecular regulatory mechanisms of circBAZ1B, a circRNA from the bromodomain adjacent to the zinc finger domain 1B (BAZ1B) gene that underlies MI/RI progression both in vitro and in vivo. Loss- and gain-of-function experiments were both conducted to elucidate the role of the circBAZ1B/miR-1252-5p/ATF3 axis in ferroptosis-associated MI/RI pathogenesis. Our findings might lead to the identification of novel potential therapeutic ferroptosis resistance targets for MI/RI attenuation.
Material and methods
Development of a rat model of MI/RI
Our research followed ethical guidelines approved by the Institutional Review Board of Zibo Central Hospital and adhered to the National Institutes of Health standards for animal research. Male adult Sprague Dawley rats (8 weeks old) were procured from the Shanghai Laboratory Animal Company (SLAC, Shanghai, China). These rats underwent MI followed by reperfusion, as outlined in prior studies [30]. For control purposes, a sham group underwent identical steps without actual constriction. After reperfusion, to distinguish the ischemic region, we administered a 1% solution of Alcian blue dye via the jugular vein. After euthanasia through cervical dislocation, we harvested heart tissues for histopathological studies and collected serum samples for biochemical assays. The myocardial infarct size was quantified using a combination of hematoxylin and eosin (H&E) and 2,3,5-triphenyltetrazolium chloride (TTC) staining techniques, differentiating between viable (red) and necrotic or infarcted (white) cardiac tissue [31].
Hypoxia-reoxygenation (H/R) cell model establishment
We utilized the H9c2 rat cardiomyoblast cell line from the American Type Culture Collection (ATCC, USA) and cultivated these cells in Dulbecco’s modified eagle medium (DMEM) supplemented with 5.5 mM glucose, 10% fetal bovine serum (FBS), and 1% penicillin-streptomycin (GIBCO, USA). The cells were maintained at 37°C in 95% air and a 5% CO2 atmosphere. To simulate hypoxia-reoxygenation in vitro, we exposed H9c2 cells to 6 h of hypoxic conditions followed by 12 h of reoxygenation, replicating the methodology of previous reports [32].
Echocardiography
Cardiac dysfunction induced by MI/RI was continuously monitored. Left ventricular pressure was measured using a microcatheter inserted into the left ventricle via the right carotid artery. Right femoral artery intubation was used for arterial pressure evaluations. Both electrocardiogram and left ventricular pressure data were concurrently recorded with an RM-6200C polygraph (Chengdu, China). Computer algorithms were used to determine heart rate, mean arterial blood pressure (MABP), left ventricular systolic pressure, left ventricular end-diastolic pressure (LVEDP), and the instantaneous first derivative of LVP (+LVdP/dtmax and -LVdP/dtmax).
Cell viability assay (CCK-8)
Cell viability was determined using a CCK-8 assay kit (Yeasen, Shanghai, China). Briefly, different H9c2 cells (transfected or controls) were seeded into 96-well plates (Corning, USA) and cultured at 37°C for 24 h. Then, 10 µl of CCK-8 solution was added to a total volume of 200 µl of medium per well in the 96-well plate. After further incubation for 2 h, the absorbance of the solutions in each well was read at 450 nm on a microplate reader (BioTek, Inc., USA).
Apoptosis analysis by flow cytometry
Cellular apoptosis was detected via flow cytometry using a commercial Annexin V-FITC/propidium iodide (PI) apoptosis double-staining kit (KeyGen, China). Briefly, different H9c2 cells (transfected or controls) were harvested by scraping, washed, and resuspended in 500 µl of Annexin V binding buffer, followed by double labeling with 5 µl of Annexin V-FITC conjugate and 5 µl of PI solution. Intracellular staining was performed in the dark for 30 min at room temperature (RT). The apoptotic rates of H9c2 cells were subsequently measured and analyzed with a Cytomics FC-500 flow cytometer (Beckman Coulter, Inc., USA).
Nuclear-cytoplasmic fractionation assay
The nuclear-cytoplasmic fractionation assay was conducted using an NE-PER Nuclear and Cytoplasmic Extraction Reagents Kit (Thermo Fisher, USA). qPCR analysis was used to determine the purities of the cellular fractions and the abundances of the genes.
Bioinformatics analysis
The hTFtarget database (https://guolab.wchscu.cn/hTFtarget/#!/) was used to analyze whether ferroptosis-associated regulators (ALOX15 ACSL4 and FTH1) could be ATF3 target genes, and we found that ACSL4 was the predicted prime candidate downstream target of ATF3. Through the use of the JASPAR database (http://jaspar.genereg.net/), putative ATF3-binding sites within the ACSL4 gene promoter were predicted and identified. Through the use of the NCBI Gene Expression Omnibus (GEO) database (https://www.ncbi.nlm.nih.gov/gds/?term=GSE149051), candidates with the three highest logFC values (significance defined as p-value < 0.5, logFC > 2) yet not reported in heart disease were considered, and hsa_circ_0115392, hsa_circ_0126393, and hsa_circ_0080478 were ultimately selected. Using the StarBase database (https://starbase.sysu.edu.cn), we predicted that the possible miRNAs miR-1252-5p, miR-23a-3p, and miR-23b-3p bind to both circBAZ1B and ATF3.
Dual-luciferase reporter assay
A dual-luciferase reporter assay was conducted with a Dual-Luciferase Reporter Assay System (Promega, USA). Briefly, H9c2 cells were cotransfected with a reporter plasmid harboring the wild-type (WT) or mutant (M) fragment of each test gene or reference control using Lipofectamine 3000 transfection reagent (Invitrogen, USA). After 48 h of incubation, H9c2 cells were collected and cultured on ice in lysis buffer. The cell lysates were subsequently subjected to luminescence intensity quantification using a Microbeta Luminescence Counter (PerkinElmer, USA). Relative luciferase activities were measured and calculated by normalizing firefly luciferase activity to Renilla luciferase activity.
RNA immunoprecipitation (RIP) assay
RIP assays were also conducted using a Magna RNA immunoprecipitation kit (Millipore, USA). Briefly, H9c2 cells (transfected or control) were collected and lysed in RIP immunoprecipitation buffer at 4°C overnight, followed by incubation with magnetic beads conjugated with anti-Ago2 or anti-IgG antibodies. The immunoprecipitated RNAs were extracted using TRIzol reagent (Invitrogen, USA), and the enrichment of target genes was subsequently analyzed via qRT–PCR.
Chromatin immunoprecipitation (ChIP) assay
ChIP was performed with a ChIP assay kit (Beyotime, China) following the manufacturer’s suggestions. Briefly, cells were cross-linked with 1% formaldehyde for 10 min and sonicated to shear DNA to lengths between 200 and 1000 base pairs. Cell lysates were pretreated with protein A/G beads and then cultivated at 4°C overnight with protein A/G beads coated with an anti-ATF3 antibody (5 µg, Abcam). Anti-rabbit immunoglobulin G (IgG) was used as a negative control. After washing and elution, the samples were treated with proteinase K and further incubated at 45 °C for 1 h. The bound DNA fragments were purified with a DNA Extraction Kit (GeneMark, Shanghai, China) and subjected to qRT–PCR.
RNA pull-down assay
The RNA pull-down assay was carried out using a magnetic RNA pull-down kit (Pierce, USA). In brief, H9c2 cell lysates were coincubated with biotin-labeled circBAZ1B, ATF3, or negative streptavidin magnetic beads overnight at 4°C. After washing, the abundance of coprecipitated RNAs was examined via qRT-PCR analysis.
Iron content assay
Iron (ferrous) contents in rat myocardial tissues or H9c2 cells were assessed using an Iron Assay Kit (Abcam, USA) according to the manufacturer’s protocols. After washing with phosphate-buffered saline (PBS) several times, tissues or cells were lysed and homogenized with iron assay lysis buffer on ice. The cell supernatant was obtained by centrifugation at 4°C for 15 min and then incubated with an iron reducer for 30 min. Then, 100 µl of iron probe was added, and the samples were thoroughly mixed and subsequently incubated for 1 h at RT. Finally, the absorbance of each group was determined at 593 nm with a microplate reader (BioTek, Inc., USA).
Lipid ROS level detection
Lipid ROS levels in rat myocardial tissues or H9c2 cells were detected using the peroxide-sensitive fluorescent 367 probe C11-BODIPY 581/591 (D3861, Thermo Fisher, USA) as previously described [33]. Samples were prepared, rinsed with PBS, and incubated with a C11-BODIPY probe for 30 min. Finally, fluorescence was detected and analyzed with a Cytomics FC-500 flow cytometer (Beckman Coulter, Inc., USA).
Enzyme-linked immunosorbent assay (ELISA)
The concentrations and activities of creatine kinase-myocardial band (CK-MB) and lactate dehydrogenase (LDH) in rat plasma were determined via ELISA using a creatine kinase activity assay kit (Sigma–Aldrich, USA) and an LDH ELISA kit (Sigma–Aldrich, USA), respectively. The absorbance of each sample was detected at 450 nm on a microplate reader (BioTek, Inc., USA).
Quantitative reverse transcription-PCR (qRT–PCR)
Briefly, total RNA was extracted from H9c2 cells by TRIzol reagent (Invitrogen), and cDNA was synthesized using a TaKaRa reverse transcription kit (TaKaRa, Japan). For qRT-–PCR, reactions were performed using the quantitative SYBR green PCR mix (Bio-Rad, USA) and run with a CFX96 Real-Time PCR Detection System (Bio-Rad, USA). The following standard cycling program was used: 95°C, 15 min; 95°C, 20 s; 45 cycles of 95°C, 15 s; and 60°C, 1 min. The β-actin gene was used as an internal control. Relative gene expression was determined and plotted according to the 2−ΔΔCt method, by which ΔΔCt = ΔCt (test gene) – ΔCt (internal control). The sequences of primers used for the RNAs used were as follows: ATF3, forward 5′-GTTGAGCTCGGGCTGGATAA-3′ and reverse 5′-CTATACTGCCGACCTGGCTG-3′; ACSL4, forward 5′-CGGTTCCTTTTTGCGAGCTT-3′ and reverse 5′-AAAGTA CGCAAATGTCCTCTTTT-3′; GAPDH, forward 5′-CCACTAGGCGCTCACTGTTCT-3′ and reverse 5′-GCATCGCCCCACTTGATTTT-3′; circBAZ1B, forward 5′-GGAGCCTTTCATGGGACAGT-3′ and reverse 5′-CTGCTGTTGTAAAGGTGCCGTG-3′; miR-1252-5p, forward 5′-GTCGTATCCAGTGCAGGGTCCGAGGTGCACTGGATACGACTAAATGA-3′ and reverse 5′-TGCGGAGAAGGAAATTGAATTCA-3′; and U6, forward 5′-GCTCGCTTCGGCAGCACA-3′ and reverse 5′-AACGCTTCACGAATTTGCGTG-3′.
Western blot analysis
The expression levels of ferroptosis-related genes/proteins (ALOX15, ACSL4, and FTH1) and ATF3 were determined via Western blot analysis. Briefly, proteins were extracted from H9C2 cell line samples using radioimmunoprecipitation assay (RIPA) lysis buffer (Beyotime, China), and the concentrations were quantified with a BCA Protein Assay Kit (Pierce, USA). Protein samples were separated via electrophoresis on a 15% SDS–PAGE gel and subsequently transferred to a polyvinylidene difluoride (PVDF) membrane (Millipore, USA). The blots were blocked with 5% nonfat milk in TBST (v/v) at RT for 1 h. The PVDF membranes were sequentially incubated with primary antibodies (1 : 2000; Abcam, USA) against ALOX15, ACSL4, FTH1, ATF3, and β-actin at 4°C overnight and then with an HRP-conjugated secondary antibody (1 : 2000; Abcam, USA) for 1 h. The membranes were washed three times, and the blots were screened and visualized after treatment with an enhanced total chemiluminescent substrate (ECL) (Thermo Fisher Scientific, USA).
Statistical analysis
Each experiment was conducted with at least three independent biological triplicates, and the data are expressed as the mean ± standard deviation (SD). All the statistical analyses were performed using GraphPad Prism (version 8.0) or SPSS 19.0 software (USA). Significant differences were examined based on Student’s t test or one-way analysis of variance (ANOVA). A p-value < 0.05 was considered to indicate statistical significance and is denoted as follows: *p < 0.05; **p < 0.01; and ***p < 0.001.
Results
MI/RI induction is accompanied by ferroptosis
In our study, MI/RI induction was closely associated with ferroptosis in rat myocardial tissues. Histological examination via H&E staining revealed distinct structural changes in the I/R group compared to the sham group, as shown in Figure 1 A. Quantitative analysis of heart tissue damage via TTC staining demonstrated a significant increase in infarct size, with the I/R group exhibiting an average of 35% of the infarct area being damaged compared to the negligible infarction in the sham controls (p < 0.001; Figure 1 B). Cardiac function evaluation via echocardiography revealed a notable decrease in left ventricular systolic pressure (LVSP) in the I/R group, with a mean value of approximately 125.48 mm Hg, which was significantly lower than that in the sham group (mean of 166.46 mm Hg). The LVEDP was substantially elevated in the I/R group, with a mean of 13.04 mm Hg, compared to 5.48 mm Hg in the sham group. Furthermore, the positive left ventricular pressure derivative (+LVdP/dtmax) was considerably lower in the I/R group, averaging 3000.44 mm Hg/s versus 5085.37 mm Hg/s in the sham group. The negative left ventricular pressure derivative (-LVdP/dtmax) followed a similar pattern, with the I/R group averaging 2580.18 mm Hg/s and the sham group averaging 3545.96 mm Hg/s (all p < 0.001; Figure 1 C).
Figure 1
MI/RI induction is accompanied by ferroptosis. A – Histological features of myocardial tissues from rats (sham and I/R groups) determined via H&E staining. B – Quantification of infarct size in rat hearts by TTC staining. C – LVEDP, LVSP, +LVdP/dt and -LVdP/dt in rats (sham and I/R groups) determined via electrocardiography. D, E – CK-MB and LDH levels in rat serum were analyzed via ELISA. F – Lipid ROS levels in rat myocardial tissues measured by flow cytometry. G – Iron (ferrous) content in rat myocardial tissues. H – Expression levels of ferroptosis-associated proteins (ALOX15, FTH1, and ACSL4) were examined via Western blotting. ***p < 0.001
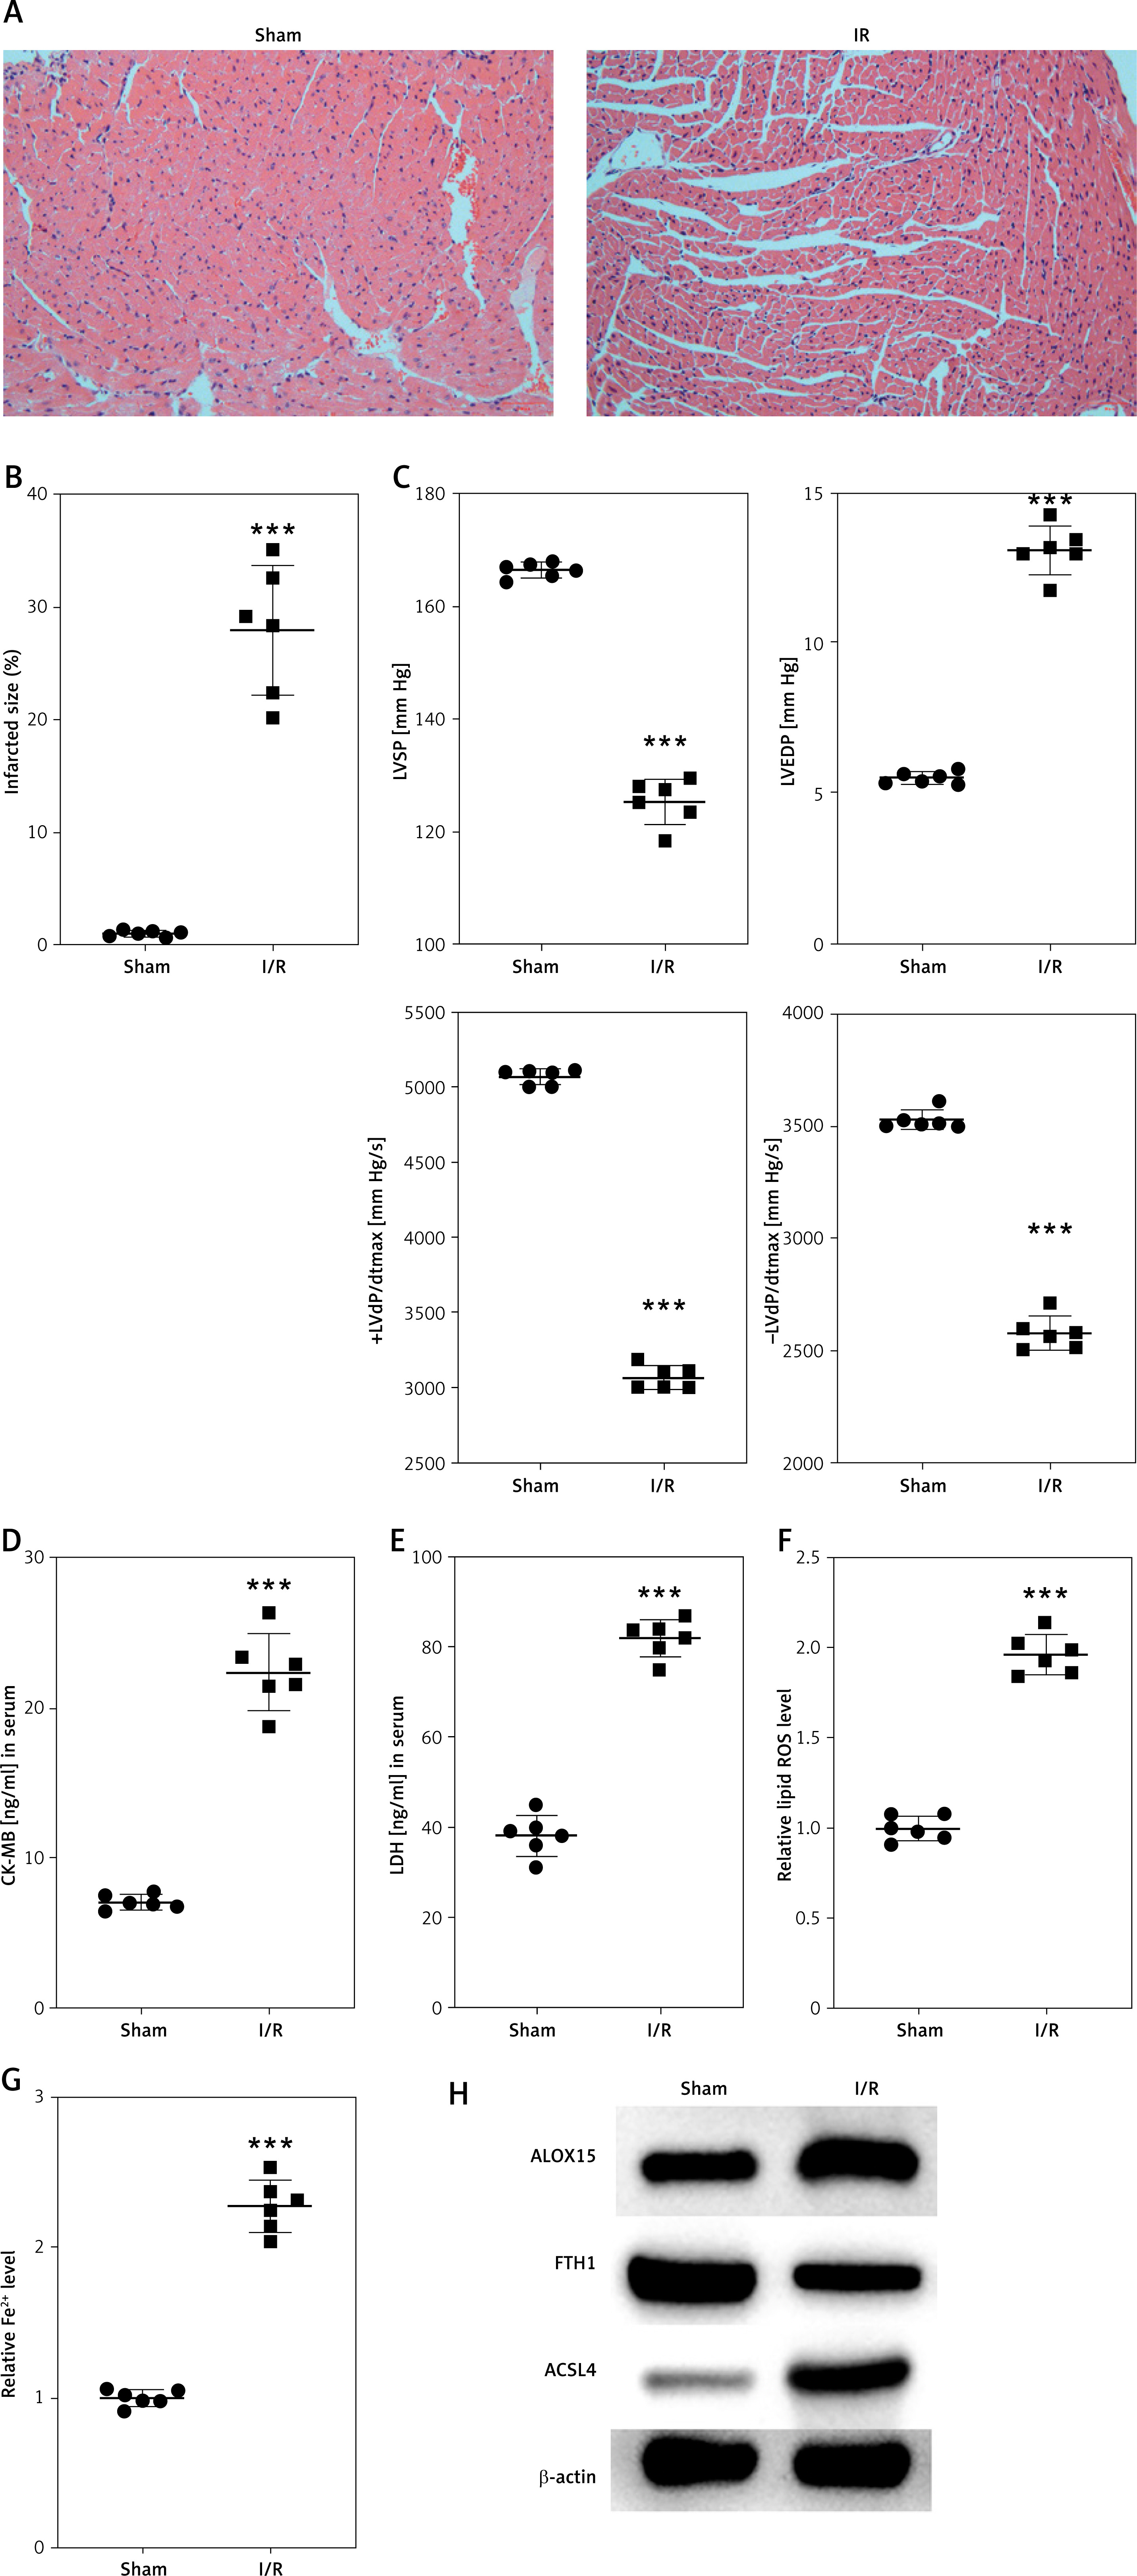
Further analysis via ELISA revealed elevated levels of CK-MB and LDH in the plasma of I/R rats compared to those in the plasma of sham controls (p < 0.001; Figures 1 D, E), suggesting the successful establishment of an in vivo MI/RI model. Additionally, we observed increased levels of lipid ROS and iron in the myocardial tissues of I/R rats (p < 0.001; Figures 1 F, G), indicating enhanced oxidative stress.
To investigate the involvement of ferroptosis in MI/RI, we analyzed the expression of proteins associated with this process through Western blotting. This analysis revealed the upregulation of proteins that promote ferroptosis (ALOX15 and ACSL4) and the downregulation of proteins that inhibit ferroptosis (FTH1) in the myocardial tissues of I/R rats (Figure 1 H). These findings collectively point to the occurrence of ferroptosis in conjunction with the MI/RI pathway.
ATF3 knockdown enhanced myocardial cell viability and inhibited ferroptosis
Our results further elucidate the role of ATF3 in MI/RI and its regulation of ferroptosis. In rat myocardial tissues affected by I/R, quantitative RT–PCR analysis revealed significant upregulation of ATF3 expression (p < 0.001; Figure 2 A), highlighting its potential involvement in MI/R. This was substantiated by in vitro studies in which H9c2 cells were subjected to hypoxia/reoxygenation (H/R), which mimics MI/RI conditions. The qRT–PCR results demonstrated considerable elevation of ATF3 expression in H/R-stimulated cells. This increase was substantially attenuated following ATF3 gene knockdown, confirming the efficiency of the silencing method (p < 0.001; Figure 2 B).
Figure 2
ATF3 knockdown enhanced myocardial cell viability and inhibited ferroptosis. A – Relative gene expression levels of ATF3 in rat myocardial tissues(sham and I/R groups) analyzed by qRT-PCR. B – Gene expression levels of ATF3 in H9c2 cells analyzed by qRT-PCR. C – The viability of H9c2 cells was determined by a CCK-8 assay. D – Apoptosis rates of H9c2 cells detected by flow cytometry. E – Lipid ROS levels in H9c2 cells detected by flow cytometry. F – Iron (ferrous) content in H9c2 cells. G – Expression levels of ferroptosis-associated proteins (ALOX15, FTH1, and ACSL4) were examined via Western blotting. **p < 0.01, ***p < 0.001
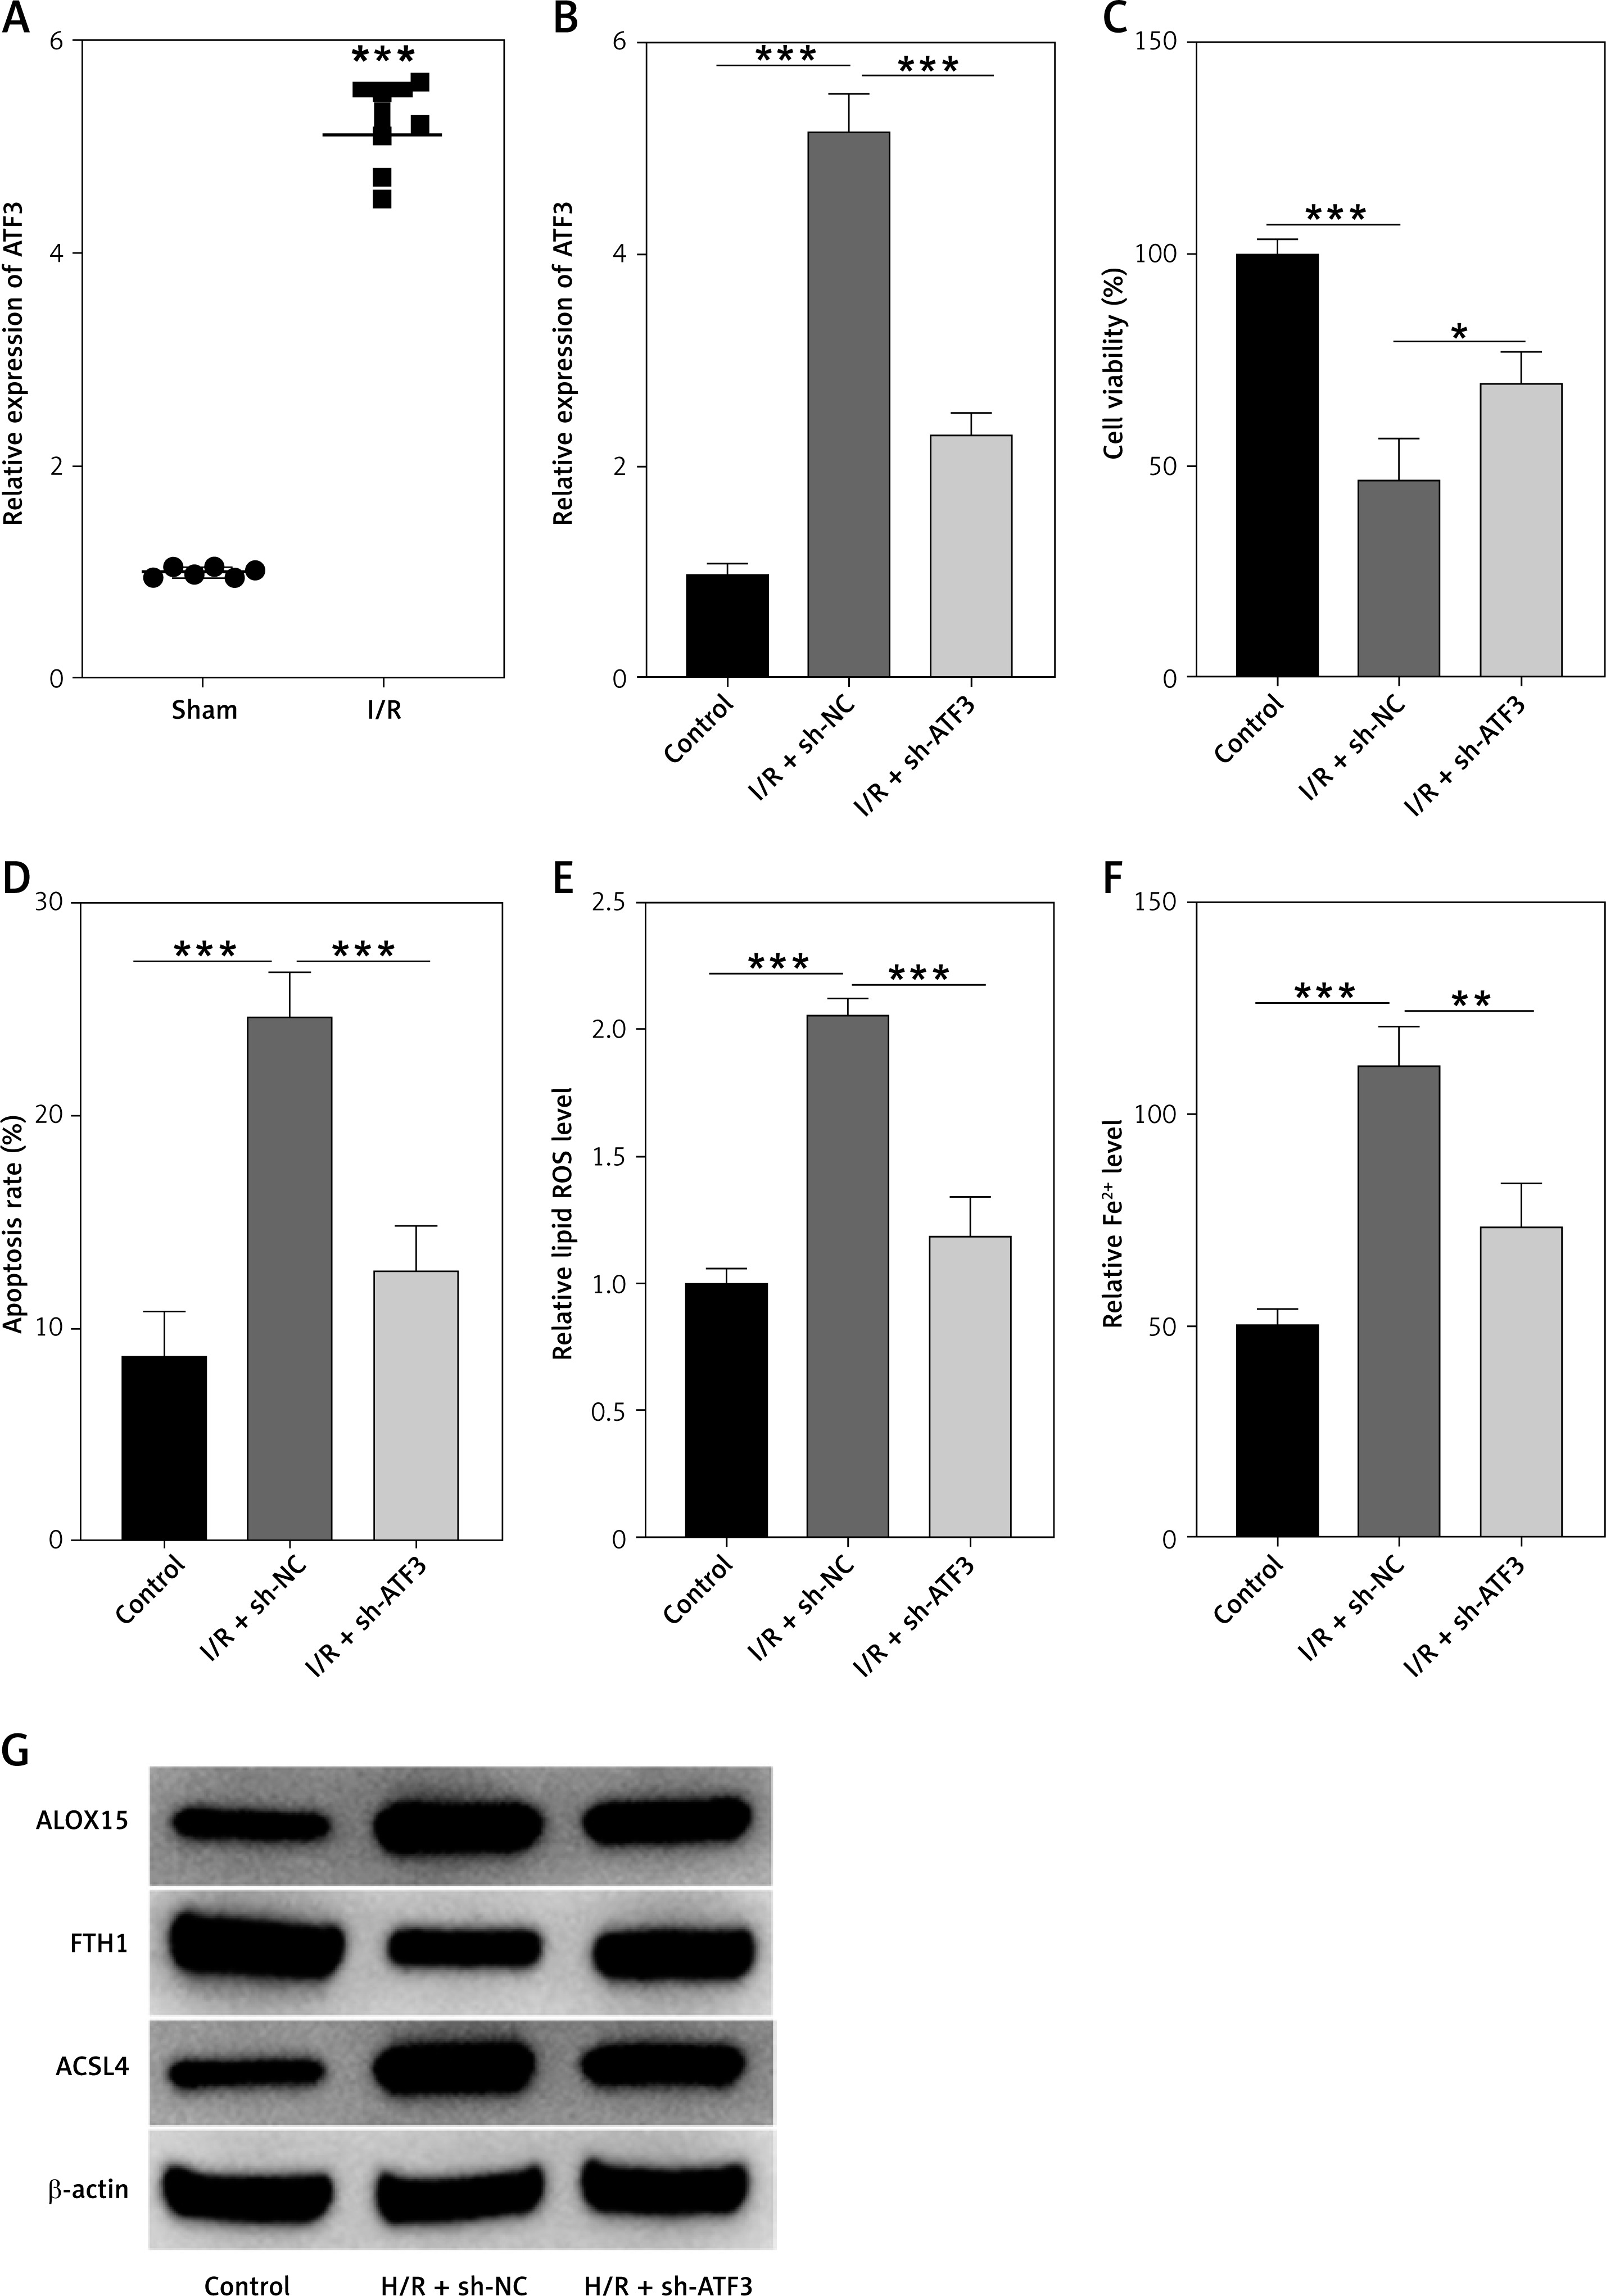
To investigate the functional consequences of ATF3 modulation, we measured cell viability using the CCK-8 assay. H9c2 cells subjected to H/R exhibited a marked reduction in viability, with the I/R + sh-NC group showing an average viability score of 46.33%, compared to the control group’s average of 100%. ATF3 knockdown under H/R conditions (the I/R + sh-ATF3 group) improved cell viability, with an average score of 69%, indicating the significant mitigation of H/R-induced cell death (all p < 0.001; Figure 2 C). Similarly, the percentage of apoptotic cells in the control group was low, at approximately 8.67%. In contrast, the I/R + sh-NC group exhibited a substantial increase in apoptosis, with an average of 24.67% (p < 0.001). Importantly, ATF3 knockdown (in the I/R + sh-ATF3 group) resulted in a significant reduction in the percentage of apoptotic cells (12.67% on average; p < 0.001), suggesting that ATF3 has a protective effect against H/R-induced apoptosis (Figure 2 D).
Furthermore, ATF3 knockdown appeared to mitigate H/R-induced oxidative stress. Lipid ROS levels, measured by flow cytometry, were significantly lower in the H/R + sh-ATF3 group than in the H/R + NC group (p < 0.001; Figure 2 E). Iron, a marker of ferroptosis, was also reduced following ATF3 knockdown (p < 0.01; Figure 2 F), suggesting that ATF3 plays a role in iron regulation during ferroptosis.
Western blot analysis provided additional insight into the molecular mechanisms involved. The expression of proteins associated with ferroptosis, such as ALOX15 and ACSL4, was elevated in H/R-treated H9c2 cells but was noticeably decreased upon ATF3 knockdown. Conversely, the ferroptosis-inhibiting protein FTH1 was downregulated in H/R-treated cells, and its expression was restored to near-control levels in cells with silenced ATF3 (Figure 2 G).
These collective findings suggest that ATF3 is not only upregulated in the context of MI/RI but also serves as a critical regulator of cell viability and ferroptosis following myocardial injury. Knockdown of ATF3 significantly enhanced cell survival and decreased the expression of ferroptosis markers, underscoring its potential as a therapeutic target for reducing myocardial damage in MI/RI.
Activation of ATF3 transcription promotes expression of the downstream target ACSL4
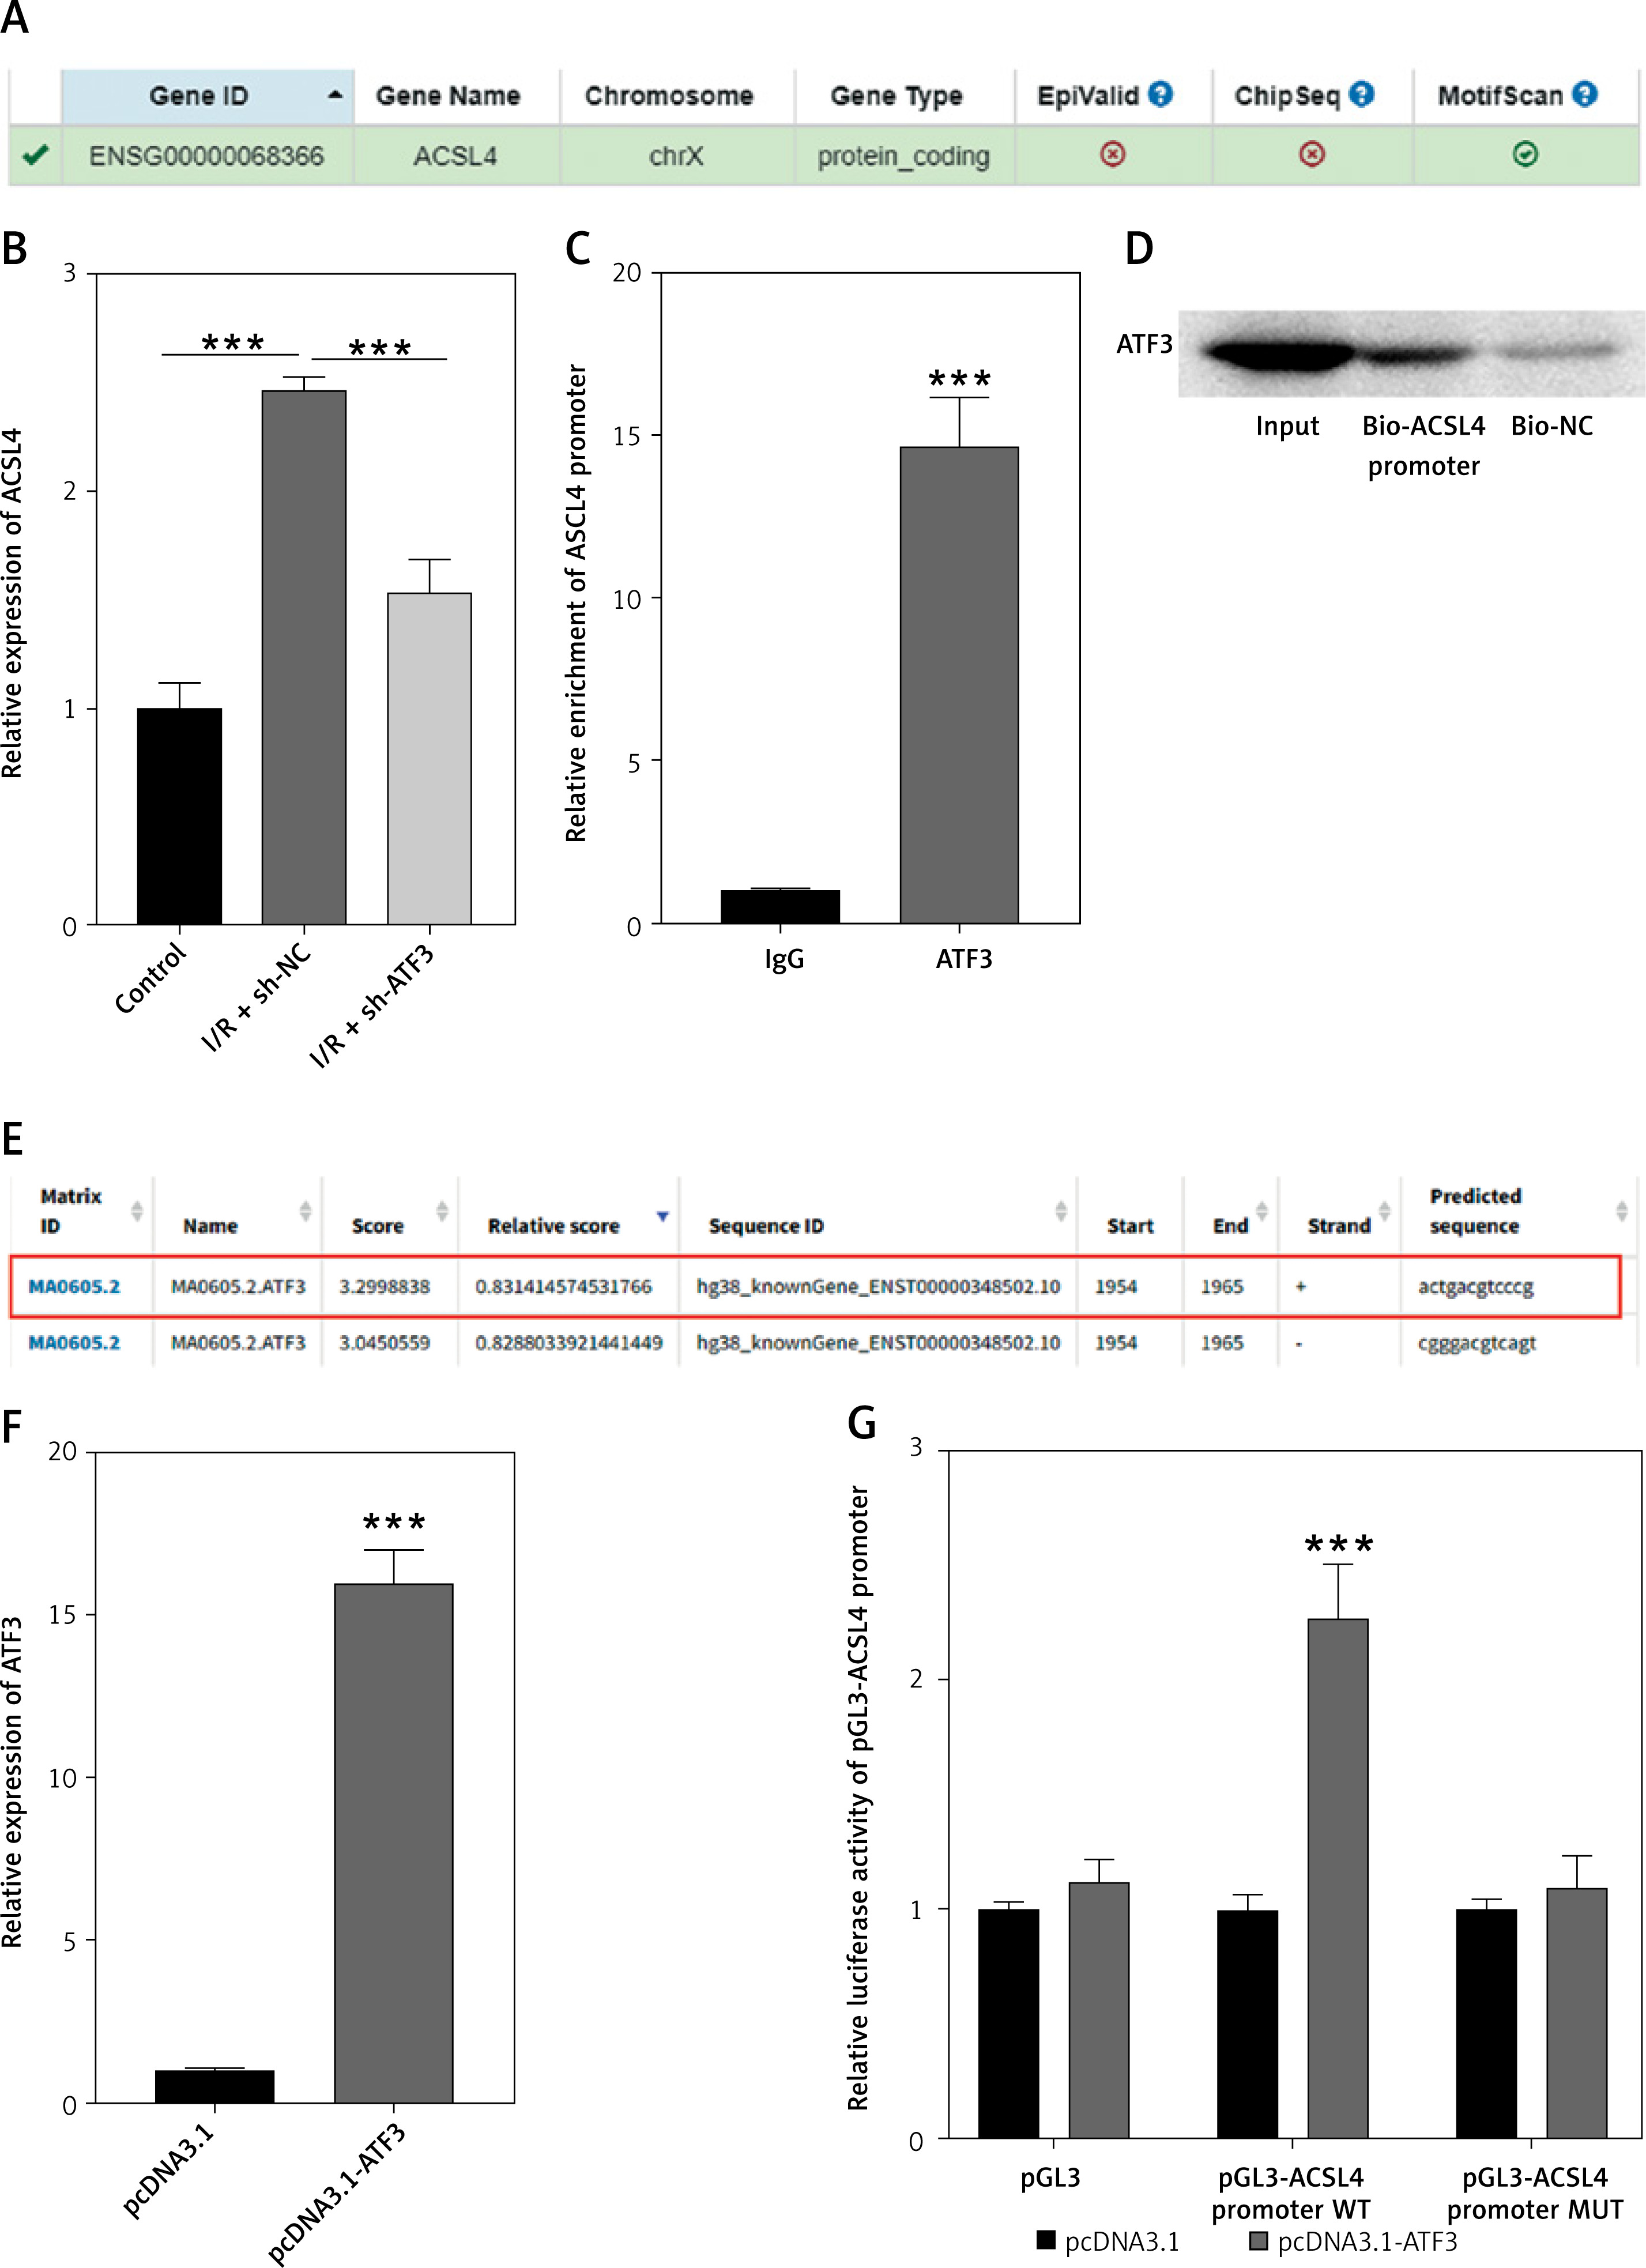
The hTFtarget database was used to analyze whether ferroptosis-associated regulators (ALOX15 ACSL4 and FTH1) could be ATF3 target genes. The results indicated that ACSL4 was the predicted prime candidate downstream target of ATF3 (Figure 3 A). qRT–PCR analysis revealed significantly greater expression of ACSL4 in hypoxia-reoxygenation (H/R)-treated H9c2 cells, which was reversed by ATF3 knockdown (p < 0.001; Figure 3 B). The enrichment of the ACSL4 promoter immunoprecipitated with the anti-ATF3 antibody in the ChIP experiment was then subjected to qRT–PCR analysis. These results indicated that ATF3 could bind to the ACSL4 promoter. Additionally, the association of ATF3 with the ACSL4 promoter was confirmed by DNA pull-down and Western blot assays (p < 0.001; Figures 3 C, D). Therefore, putative ATF3-binding sites within the ACSL4 gene promoter were predicted and acquired from the JASPAR database (http://jaspar.genereg.net/) (Figure 3 E). We next successfully constructed an ATF3 overexpression model in H/R-treated H9c2 cells and discovered that overexpression of ATF3 could increase the luciferase activity of the pGL3-ACSL4 promoter wild type but had no effect on that of the pGL3-ACSL4 promoter mutant site (p < 0.001; Figures 3 F, G). These results suggested that the activation of ATF3 transcription promoted the expression of the downstream target ACSL4.
Figure 3
Activation of ATF3 transcription promotes expression of the downstream target ACSL4. A – Downstream target genes of ATF3 were analyzed and predicted via the hTFtarget database. B – Relative gene expression levels of ACSL4 in H9c2 cells analyzed by qRT-PCR. C – Enrichment of the ACSL4 promoter immunoprecipitated with ATF3 in the chromatin immunoprecipitation (ChIP) assay followed by qRT-PCR analysis. D – Association of ATF3 with the ACSL4 promoter was verified by DNA pull-down and Western blot assays. E – Putative binding sites of ATF3 within the ACSL4 gene promoter predicted via the JASPAR database. F – Overexpression efficiency of ATF3 in H9c2 cells confirmed by qRT-PCR. G – Induction of the ACSL4 gene promoter by ATF3 was verified by a dual-luciferase reporter assay. ***p < 0.001
circBAZ1B participates in ATF3 regulation via a possible ceRNA mechanism
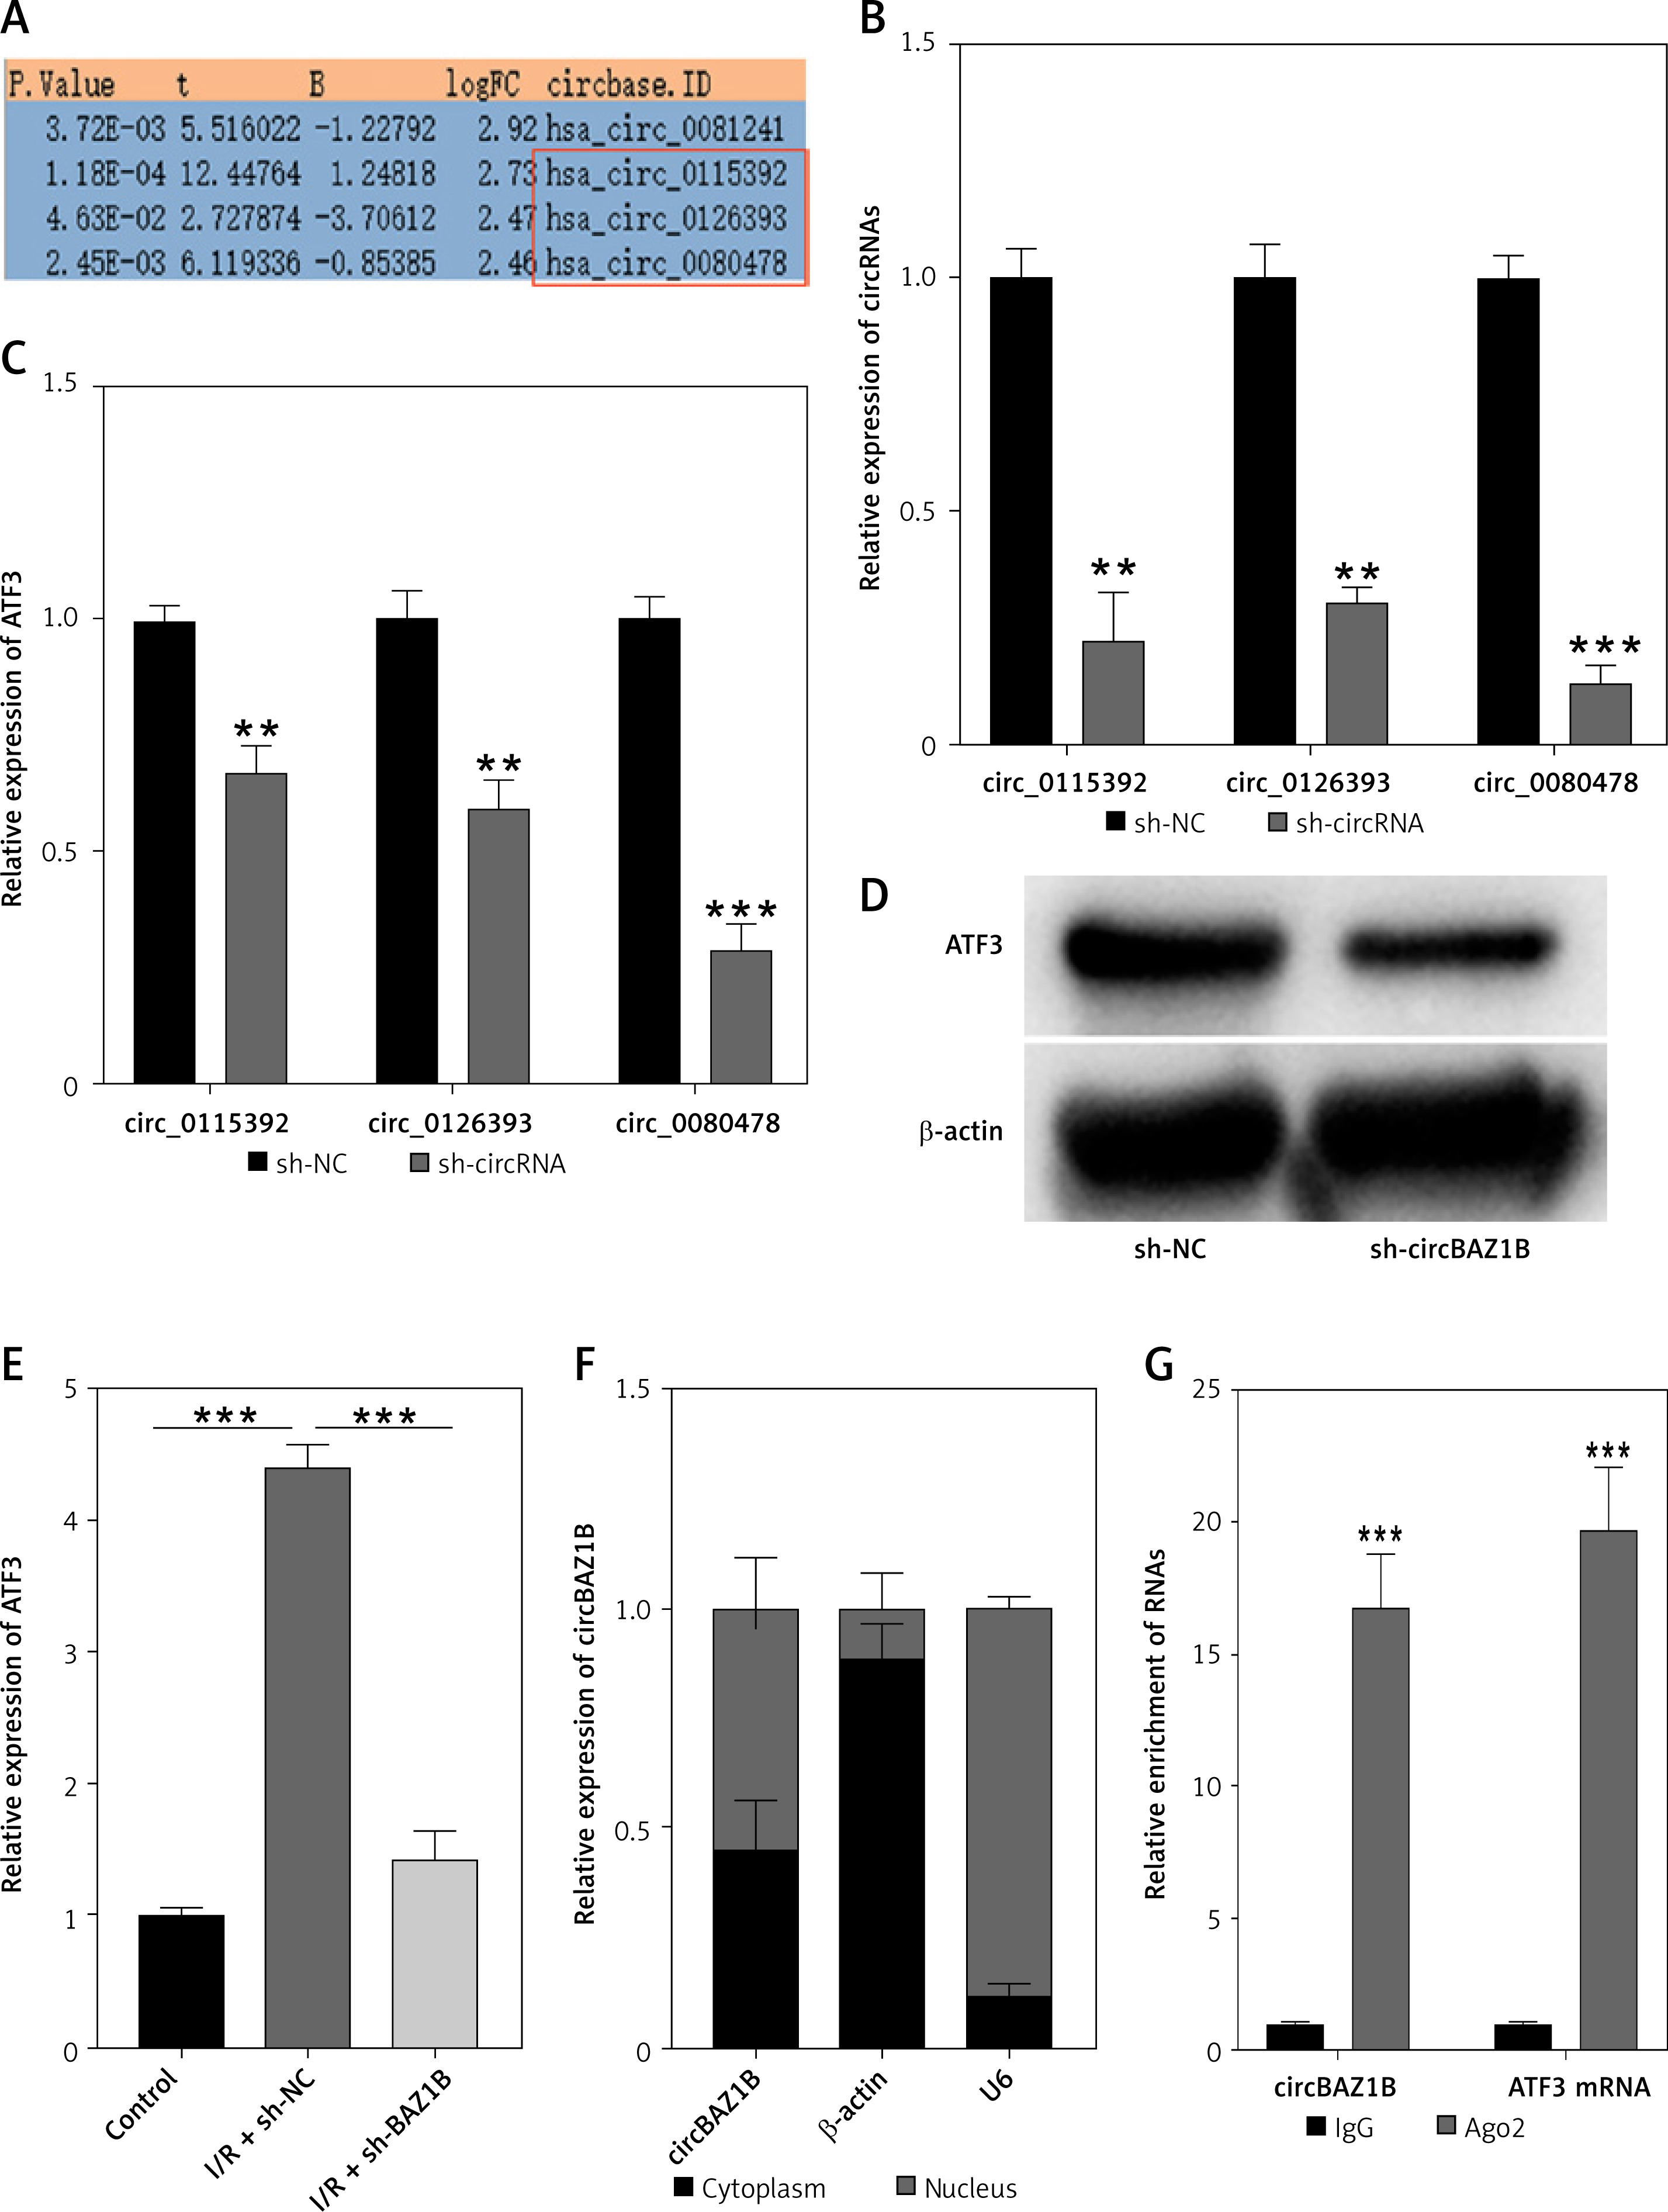
To explore the potential molecular mechanism governing ATF3 behavior during MI/RI, we further established a ceRNA–mRNA regulatory network based on the potential ceRNA hypothesis. Therefore, circRNAs significantly overexpressed in AMI patient blood were screened out based on the NCBI GEO database (accession no. GSE149051). Candidates ranking in the top three for the logFC value (significance defined as P value<0.5, logFC>2) yet not reported in heart disease were considered. As shown in Figure 4 A, hsa_circ_0115392, hsa_circ_0126393, and hsa_circ_0080478 were ultimately selected. The interference efficiency of hsa_circ_0115392 (p < 0.01), hsa_circ_0126393 (p < 0.01), and hsa_circ_0080478 (p < 0.001) was confirmed by qRT–PCR (Figure 4 B). The expression of ATF3 after interference with circRNA candidates was further examined. The qRT–PCR results indicated that ATF3 expression was downregulated in all three candidate circRNA interference groups, among which circ_0080478 presented the most significant change (p < 0.001) (Figure 4 C). Therefore, circ_0080478 was selected as our main research object in this study. In reference to its parental gene BAZ1B, circ_0080478 was also named circBAZ1B. The downregulation of ATF3 protein expression after circBAZ1B interference was also confirmed by Western blot analysis (Figure 4 D). Moreover, in the hypoxia-reoxygenation (H/R) H9c2 cell model, ATF3 was significantly overexpressed in the H/R-induced group but was dramatically inhibited by circBAZ1B interference (p < 0.001; Figure 4 E). The subcellular localization of circBAZ1B was also determined via a nuclear-cytoplasmic fractionation assay followed by qRT–PCR analysis. The results revealed that circBAZ1B was primarily localized in the cytoplasm (Figure 4 F). Additionally, the enrichment and binding efficiency of circBAZ1B and ATF3 against anti-Ago2 or anti-IgG antibodies in H9c2 cells were verified through RIP and qRT-PCR analyses. The results demonstrated that both circBAZ1B and ATF3 were enriched in complexes that could be pulled down by the anti-Ago2 antibody (p < 0.001; Figure 4 G), indicating that circBAZ1B participated in ATF3 regulation via a possible ceRNA mechanism.
Figure 4
CircBAZ1B participates in ATF3 regulation via a possible ceRNA mechanism. A – CircRNAs significantly overexpressed in AMI patient blood were screened out using the GEO database (accession no. GSE149051). Significance was defined as follows: p-value < 0.5 and logFC > 2. B – The interference efficiency of three circRNA candidates (circ_0115392, irc_0126393, and circ_0080478) was examined by qRT-PCR. C – qRT-PCR analysis of ATF3 gene expression after interference with three circRNA candidates (circ_0115392, irc_0126393, and circ_0080478). D – Western blot analysis of ATF3 protein expression after circBAZ1B interference. E – Relative gene expression levels of ATF3 in H9c2 cells analyzed by qRT-PCR. F – Subcellular localization of circBAZ1B determined by a nuclear-cytoplasmic fractionation assay and qRT-PCR analysis. G – The binding efficiency of circBAZ1B and ATF3 against anti-Ago2 or anti-IgG antibodies in H9c2 cells was verified by RIP-qRT-PCR assays. **p < 0.01, ***p < 0.001
circBAZ1B promotes ATF3 expression through miR-1252-5p
Our study further investigated the underlying mechanisms by which circBAZ1B interference impacts the expression of ATF3. Utilizing StarBase predictions and Venn diagrams, we narrowed down the list of potential miRNAs to three candidates: miR-1252-5p, miR-23a-3p, and miR-23b-3p. These were identified as the most likely miRNAs to interact with circBAZ1B (Figure 5 A). To verify these interactions, we conducted RNA pull-down assays to test the binding efficiencies of these miRNAs with circBAZ1B. Notably, miR-1252-5p exhibited the highest affinity for binding with circBAZ1B, making it the primary focus of our subsequent analyses (p < 0.01; Figure 5 B).
Figure 5
CircBAZ1B promotes ATF3 expression through miR-1252-5p. A – Intersections predicted by StarBase and a Venn diagram. B – The binding efficiency of potential targeting miRNAs (miR-1252-5p, miR-23a-3p, and miR-23b-3p) with circBAZ1B was examined by RNA pull-down and qRT-PCR analysis. C – Enrichment of miR-1252-5p was assessed with an RNA pull-down assay followed by qRT–PCR analysis. D – Putative binding sites of miR-1252-5p with circBAZ1B and ATF3 predicted by StarBase. Direct binding of miR-1252-5p to (E) circBAZ1B and (F) ATF3 was verified by dual-luciferase reporter assay. G – Gene expression levels of ATF3 in H9c2 cells analyzed by qRT–PCR. H – Protein expression levels of ATF3 in H9c2 cells detected by Western blot analysis. **p < 0.01, ***p < 0.001
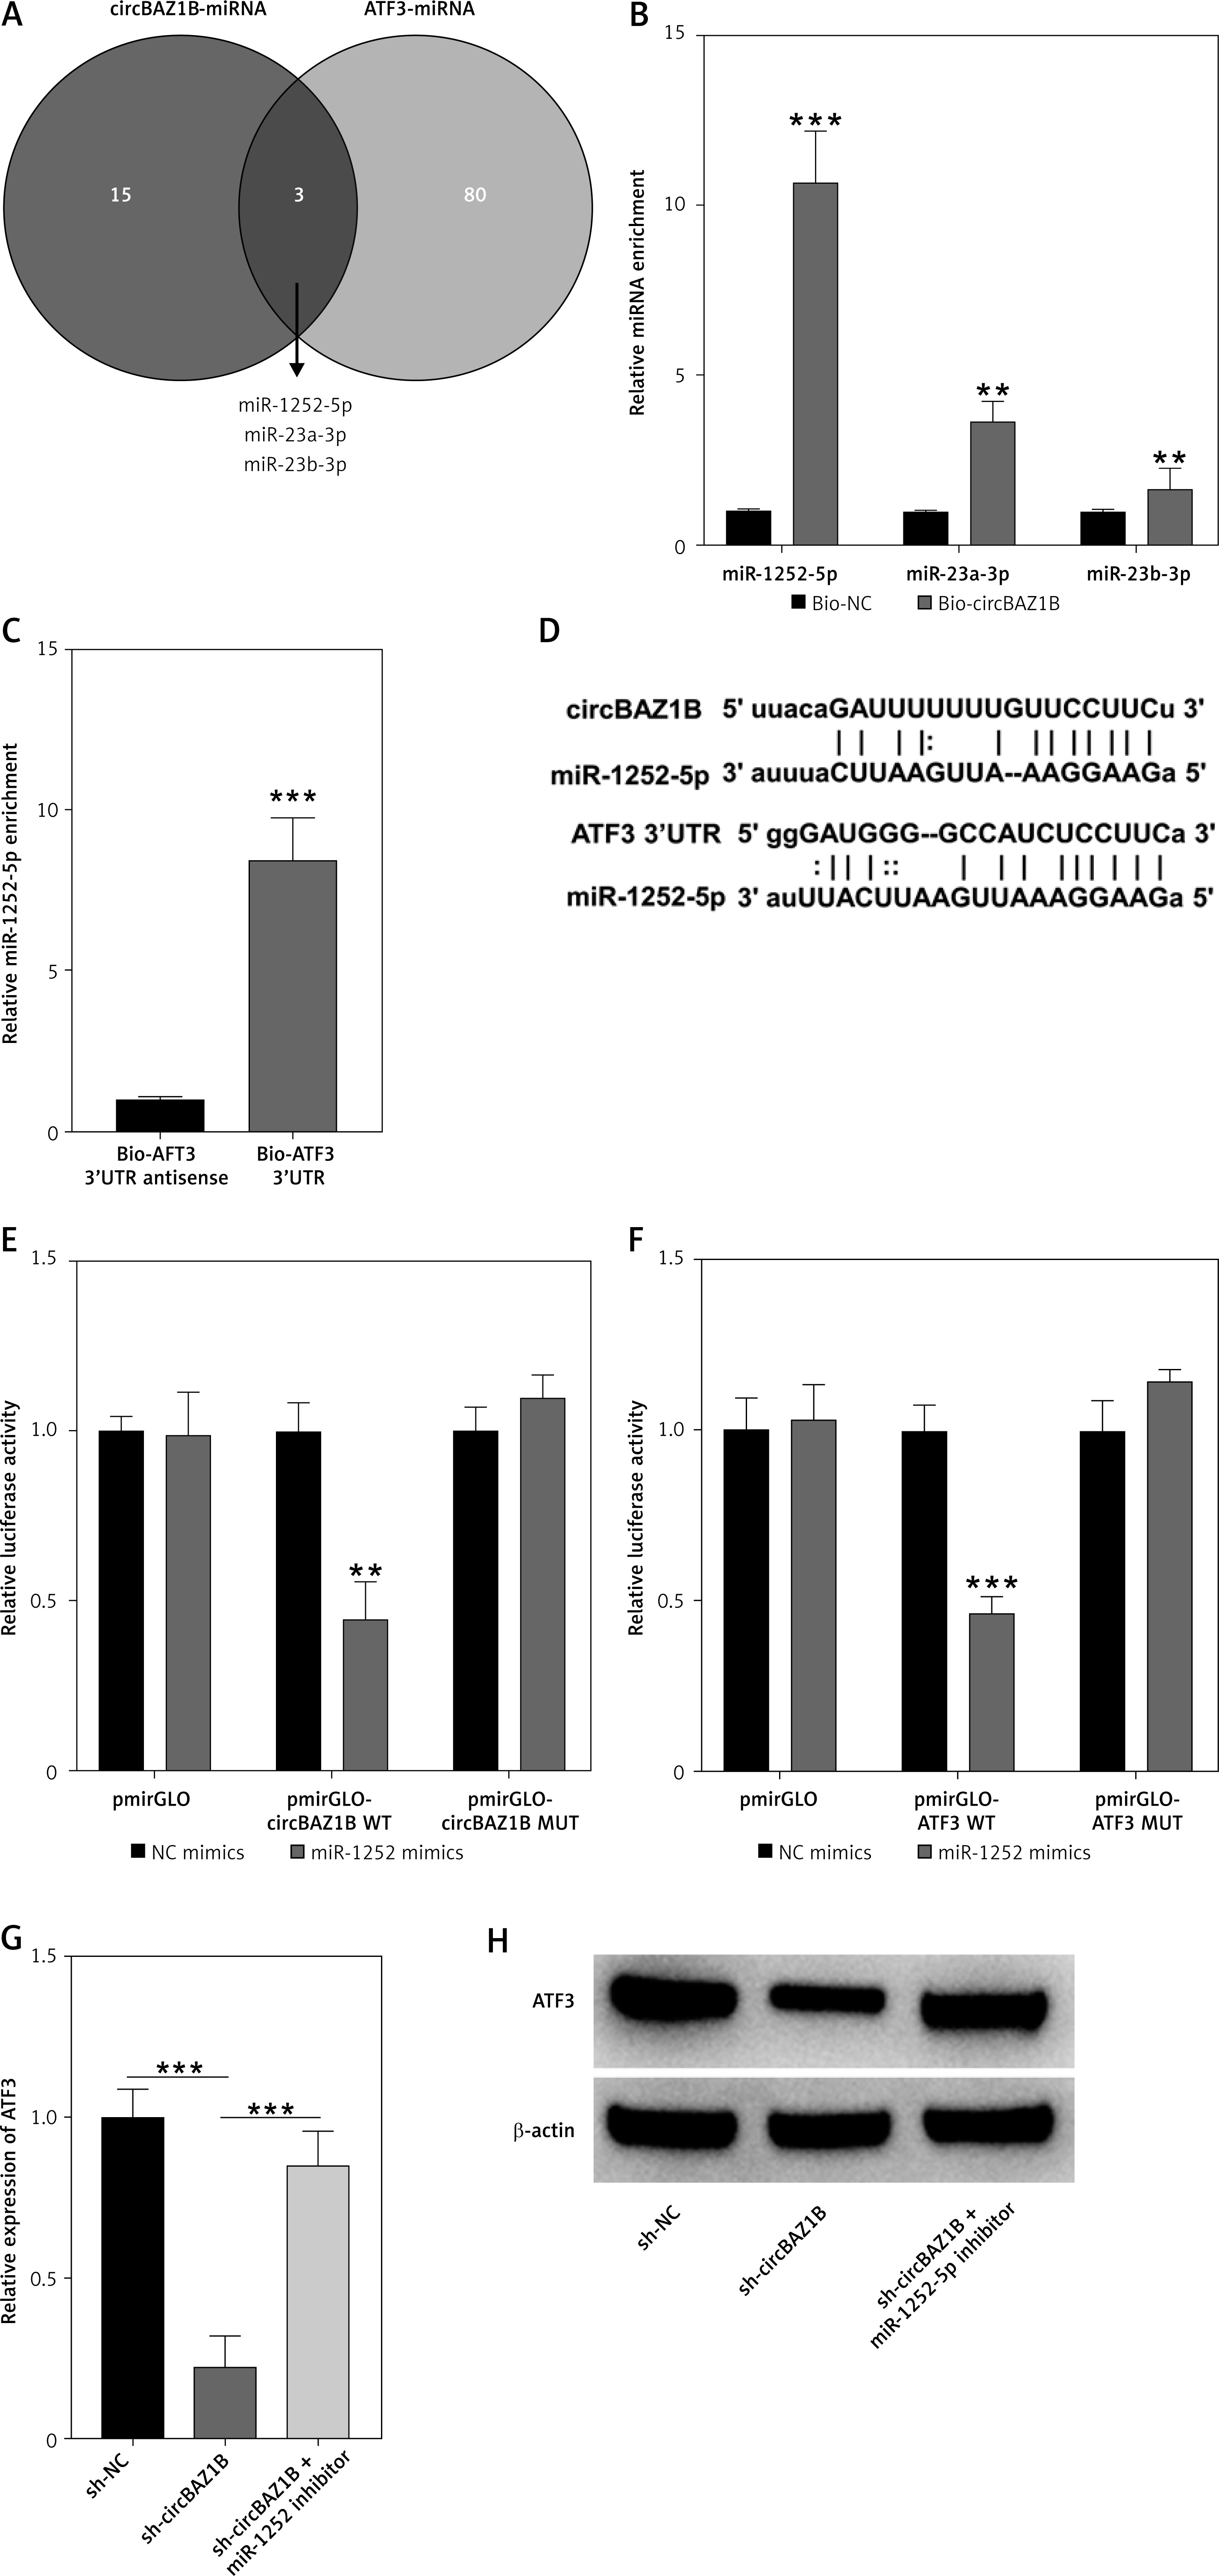
Further examination via RNA pull-down assays indicated that miR-1252-5p binds to the 3′ untranslated region (3′UTR) of ATF3, as illustrated in Figure 5 C (p < 0.001). Predictive analyses using starBase suggested potential binding sites for miR-1252-5p on both circBAZ1B and ATF3 (Figure 5 D). These predictions were substantiated by dual-luciferase reporter assays, which confirmed the direct interaction of miR-1252-5p with both circBAZ1B (p < 0.01) and ATF3 (p < 0.001) (Figures 5 E, F).
Quantitative RT–PCR and Western blot analyses were also used to assess the impact of circBAZ1B interference on ATF3 expression. These results indicated that circBAZ1B disruption led to decreased ATF3 expression. However, this suppression was counteracted by the application of a miR-1252-5p inhibitor (p < 0.001), as depicted in Figures 5 G, H. Thus, our findings suggest a regulatory pathway in which circBAZ1B enhances ATF3 expression through its interaction with miR-1252-5p.
CircBAZ1B inhibits cardiomyocyte activity and promotes ferroptosis by regulating ATF3
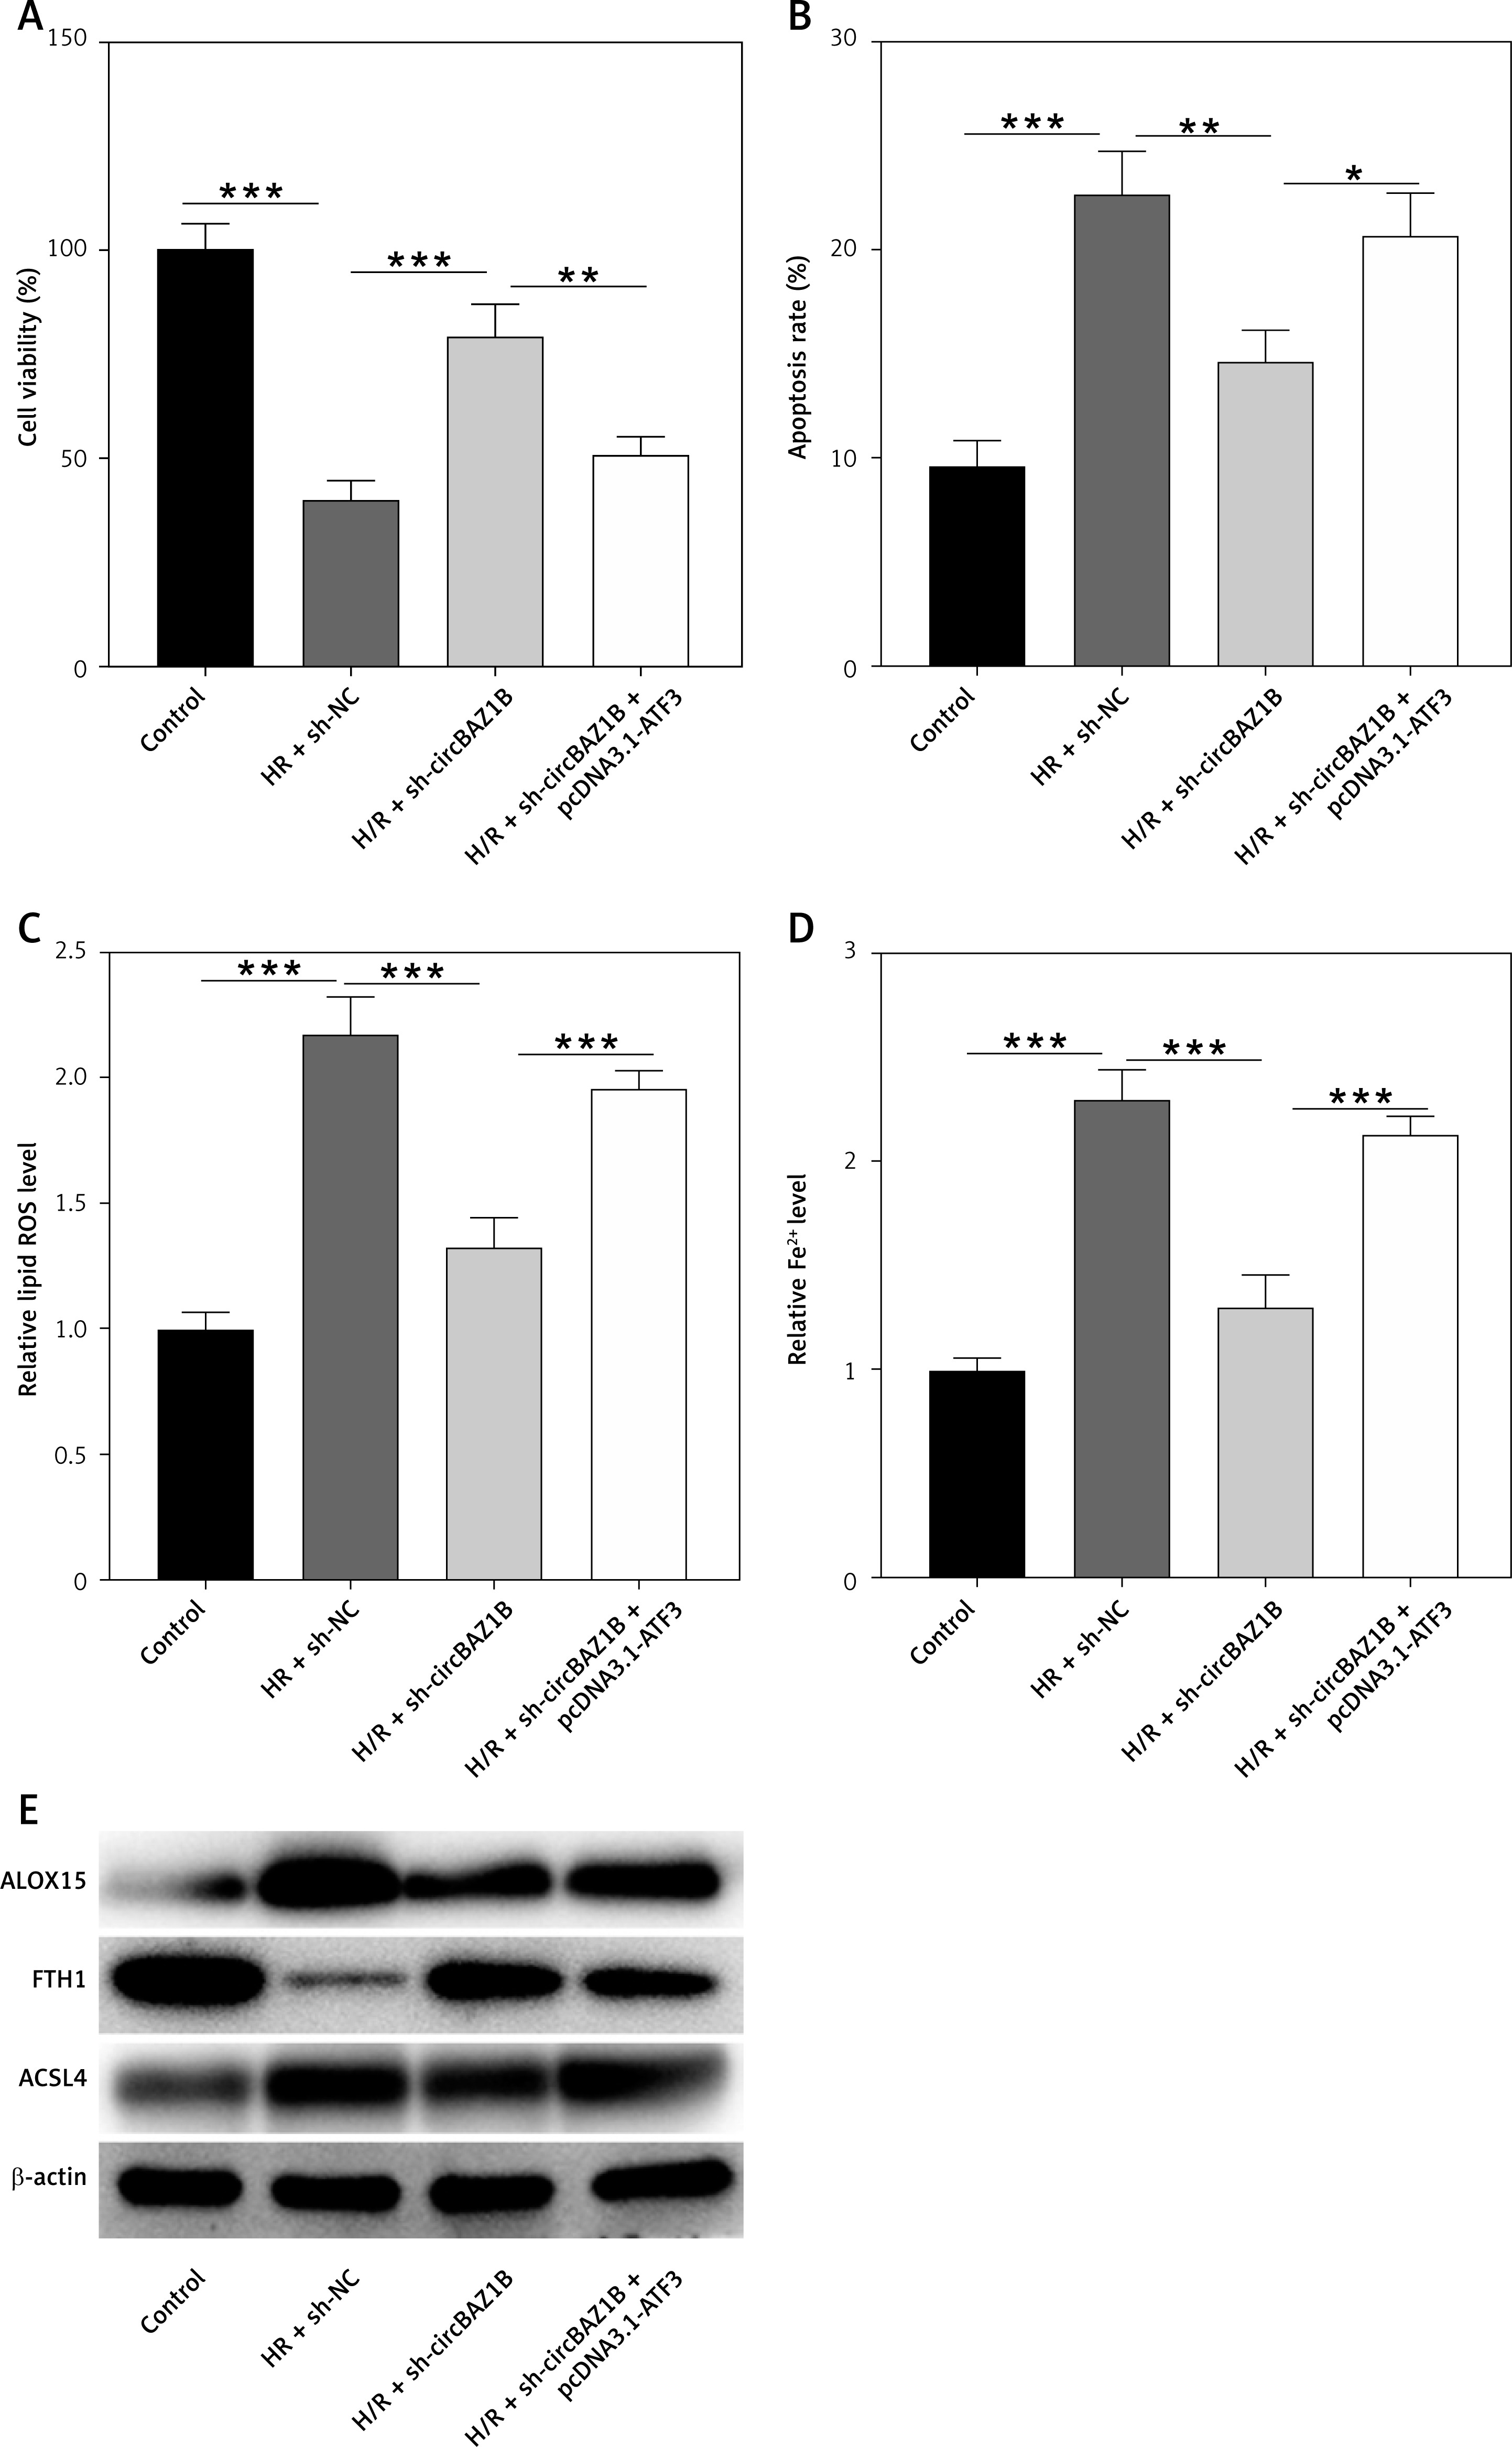
We further examined the biological functions of circBAZ1B and its downstream target ATF3 in a hypoxia-reoxygenation (H/R) H9c2 cell model. Cell viability, apoptosis, lipid ROS levels, and iron (ferrous) contents were subsequently validated by a CCK-8 assay, flow cytometry, and biochemical analysis. Taken together, these findings demonstrated that circBAZ1B interference significantly promoted cell viability (p < 0.001; Figure 6 A) while inhibiting apoptosis (p < 0.01; Figure 6 B), lipid ROS levels (p < 0.001; Figure 6 C), and iron (ferrous) content (p < 0.001; Figure 6 D) in H/R-treated H9c2 cells. Moreover, Western blot analysis demonstrated a significant decrease in ferroptosis-promoting proteins (ALOX15 and ACSL4) and an increase in ferroptosis-inhibiting proteins (FTH1) in circBAZ1B-silenced (H/R) H9c2 cells (p < 0.001; Figure 6 E). However, these effects could be reversed by ATF3 overexpression (Figures 6 A–E). Collectively, these results indicated that circBAZ1B inhibited cardiomyocyte activity and promoted ferroptosis by regulating ATF3.
Figure 6
CircBAZ1B inhibits cardiomyocyte activity and promotes ferroptosis by regulating ATF3. A – The viability of H9c2 cells was detected by a CCK-8 assay. B – Apoptosis of H9c2 cells detected by flow cytometry. C – Lipid ROS levels in H9c2 cells assessed by flow cytometry. D – Iron (ferrous) content in H9c2 cells. E – Ferroptosis-associated protein (ALOX15, FTH1, and ACSL4) expression was determined via Western blotting. *p < 0.05, **p < 0.01, ***p < 0.001
circBAZ1B stimulates MI/RI progression in vivo
We assessed the histological characteristics of myocardial tissues from rats in three different groups, sham, IR + sh-NC, and IR + sh-circBAZ1B, using H&E and TTC staining methods. The analysis revealed a larger infarct size in the IR + sh-NC group compared to the sham group. However, this effect was mitigated by circBAZ1B interference (p < 0.001; Figures 7 A, B). Furthermore, echocardiographic analysis indicated a notably higher LVEDP in the IR + sh-NC group compared with the sham group. In parallel, LVSP, along with both the positive and negative derivatives of left ventricular pressure over time (+LVdP/dt and -LVdP/dt), decreased. These alterations were counteracted by the depletion of circBAZ1B, as shown in Figure 7 C (p < 0.001).
Figure 7
CircBAZ1B stimulates MI/RI progression in vivo. A – Histological features of myocardial tissues from rats (sham, IR + sh-NC, and IR + sh-circBAZ1B) determined via H&E staining. B – Quantification of the relative infarct size in rat hearts by TTC staining. C – LVEDP, LVSP, +LVdP/dt and -LVdP/dt in rats (sham, IR + sh-NC, and IR + sh-circBAZ1B) determined by electrocardiography. D, E – CK-MB and LDH levels in rat serum were measured via ELISA. F – Lipid ROS levels in rat myocardial tissues detected by flow cytometry. G – Iron (ferrous) content in rat myocardial tissues. H – Expression levels of ferroptosis-associated proteins (ALOX15, FTH1, and ACSL4) were analyzed via Western blotting. ***p < 0.001
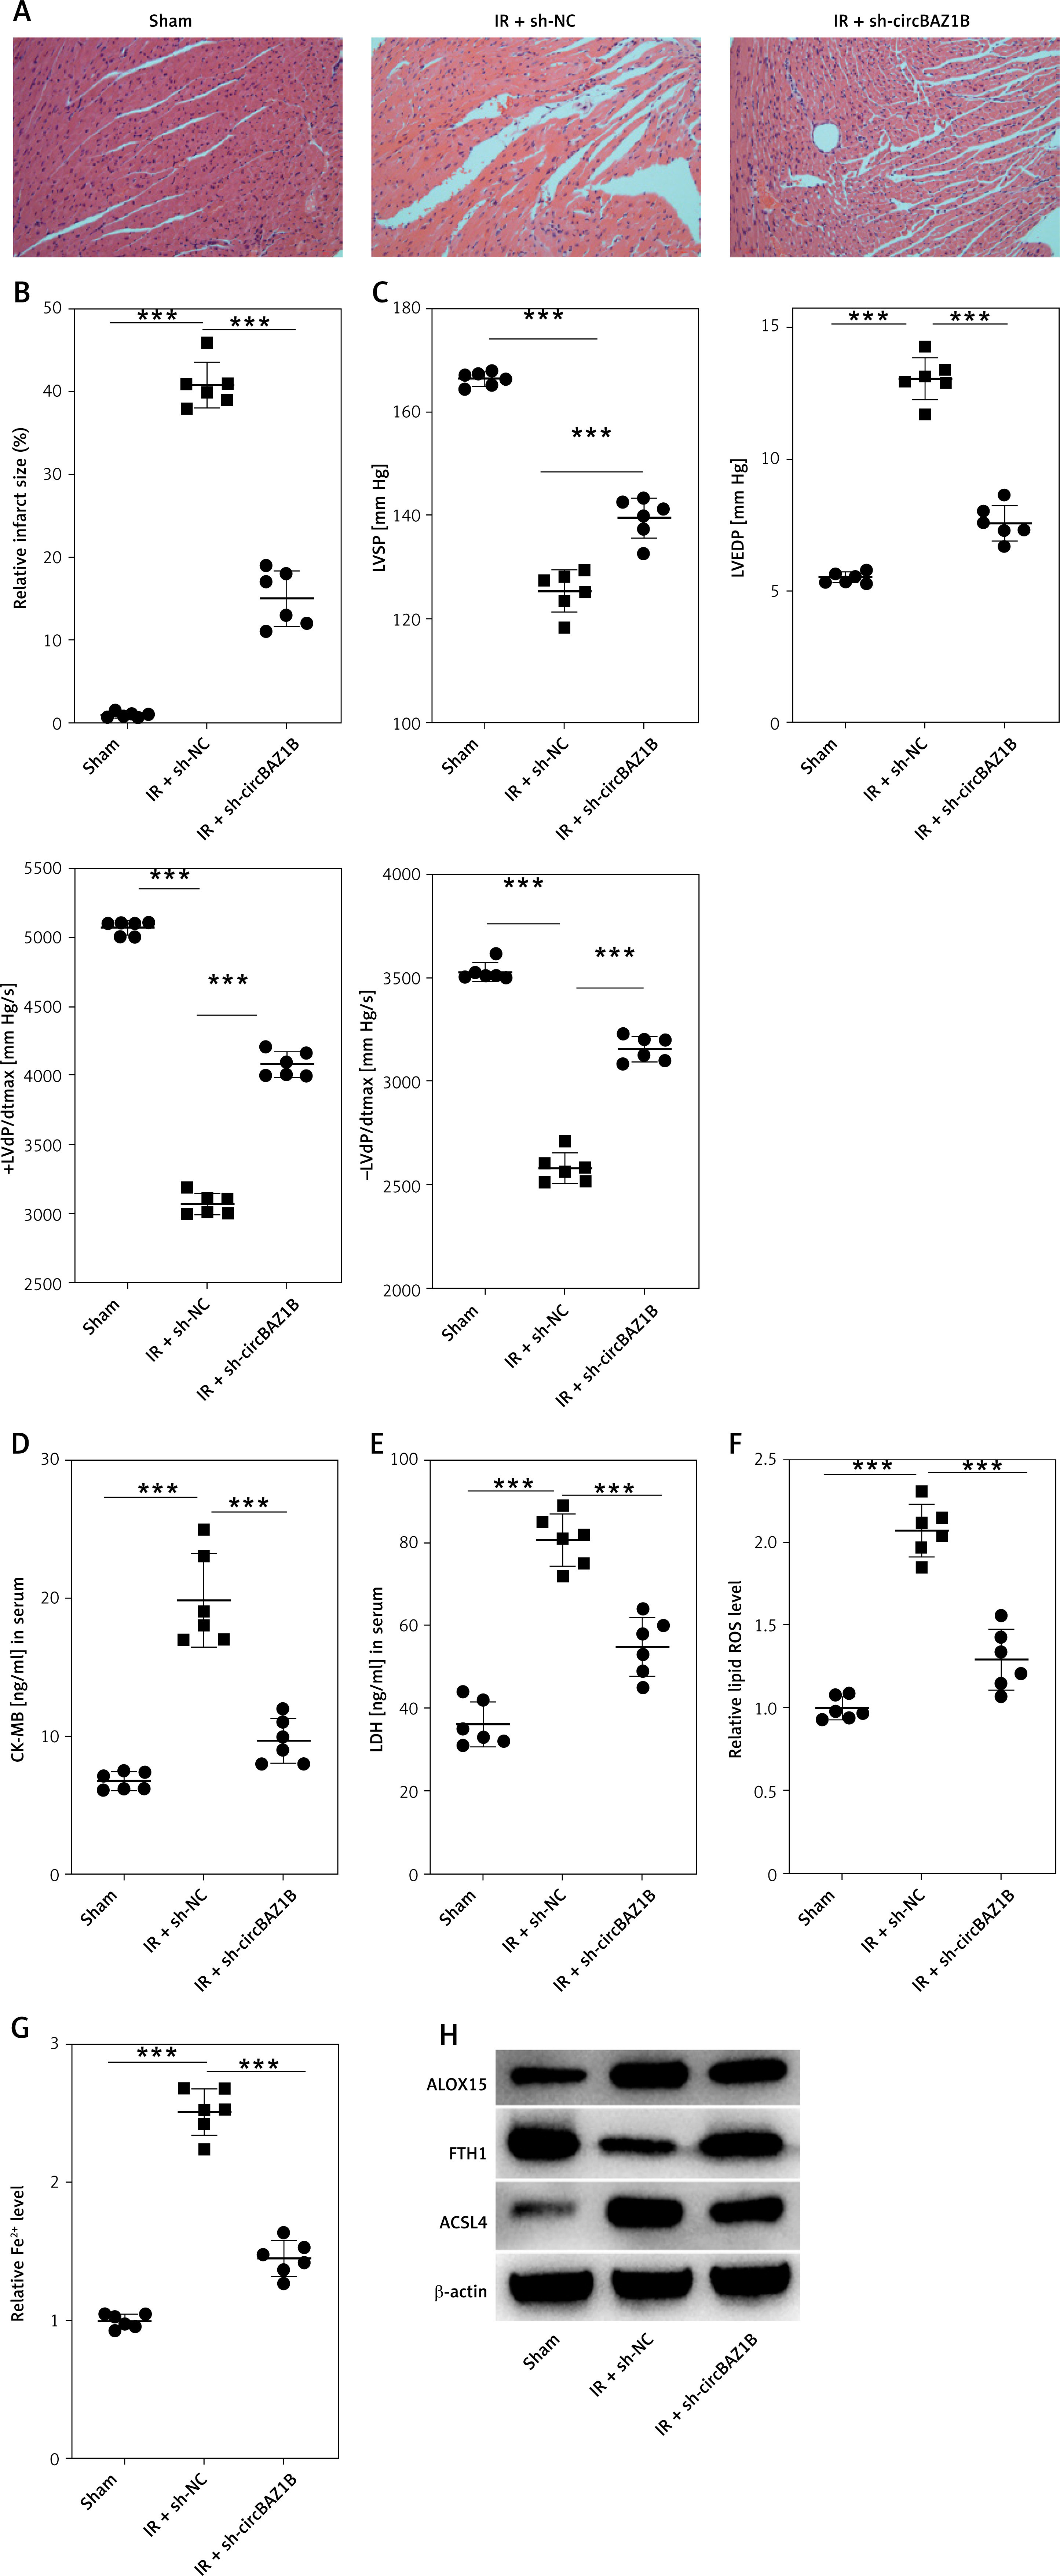
The evaluation of plasma biomarkers through ELISA demonstrated significantly greater CK-MB and LDH levels in the IR group than in the sham and circBAZ1B interference groups, as depicted in Figures 7 D, E (p < 0.001). Additionally, lipid ROS levels and iron content in myocardial tissues from I/R rats were significantly higher than those in the sham control or IR + sh-circBAZ1B group (p < 0.001; Figures 7 F, G). The expression of ferroptosis-related proteins, including ALOX15, FTH1, and ACSL4, was further confirmed by Western blot analysis, and the results are presented in Figure 7 H.
Discussion
Increasing evidence from preclinical research has indicated that abnormal ferroptosis in cells is associated with diverse human diseases, including MI/RI [6, 18, 34]. Here, in our study, rats subjected to MI surgery followed by RI exhibited increased lipid ROS production and Fe2+ accumulation. Consistent with these findings, Western blot analysis further revealed significantly increased expression of ferroptosis-promoting proteins (ALOX15 and ACSL4) and decreased expression of ferroptosis-inhibiting protein (FTH1) in I/R rat myocardial tissues. Similar results were obtained from in vitro assays conducted with the hypoxia-reoxygenation (H/R) H9c2 cell line. Our observations indicated that the MI/RI pathway was accompanied by ferroptosis, which was also in agreement with previously reported findings.
It is widely accepted that MI/RI is complicated by aberrant regulation or dysfunction of key regulators in a diverse range of pathophysiological processes and molecular bases, including autophagy, cell apoptosis, mitochondrial dysfunction, and inflammation [35–39]. CircRNAs have been extensively studied and proven to have diverse and essential roles closely associated with multiple human diseases, including MI/RI [40, 41]. In this study, circRNAs significantly overexpressed in the blood of AMI patients were analyzed using the GSE149051 database. A novel circRNA, circ_0080478 (circBAZ1B), with the most significantly high expression level was identified in this study and subjected to functional assays. Loss- and gain-of-function experiments further indicated that circBAZ1B promoted H9c2 cell ferroptosis, as evidenced by significantly increased lipid ROS accumulation, excessive iron (Fe2+) deposition, and dysregulation of ferroptosis-associated protein expression. Mechanistically, by modulating miR-1252-5p/ATF3-mediated ferroptosis, circBAZ1B enhances MI/RI pathogenesis. Collectively, our findings support the hypothesis that circBAZ1B might be a crucial regulator of MI/RI-induced ferroptosis.
Current investigations of miR-1252-5p and its clinical value have focused mainly on cancer research [42–45]. To date, no studies have reported the association between miR-1252-5p and MI/R injury. Here, in our study, circBAZ1B sponged miR-1252-5p and positively regulated ATF3, thereby facilitating the ferroptosis process and stimulating MI/RI pathogenesis.
An important limitation of our study is the use of rat models and H9c2 cardiomyoblasts for in vitro experiments. While these models provide valuable insights into the mechanisms of MI/RI and ferroptosis, there are inherent limitations when translating these findings to human physiology. The discrepancy between human and rat myocardial responses, attributed to differences in gene expression, cellular responses, and overall cardiac physiology, underscores a critical limitation in our study [46]. Consequently, while our results offer promising directions for understanding and potentially treating MI/RI in humans, further research involving human tissue or clinically relevant models is essential to confirm these findings and evaluate their direct applicability to human MI/RI treatment. This step is crucial for bridging the gap between preclinical research and clinical application, ensuring that therapeutic strategies developed from these findings are both safe and effective in human patients [47].
In conclusion, we reported that circBAZ1B facilitates MI/RI by modulating miR-1252-5p/ATF3-mediated ferroptosis. Our newly identified ferroptosis-associated circBAZ1B biomarker might serve as a novel potential therapeutic target for attenuating MI/RI.