Introduction
Alzheimer’s disease (AD), a devastating neurological condition that primarily affects the elderly and results in the degeneration of brain cells, is characterized by a decline in thinking, cognitive functions, and independence in daily activities, which lead to a loss of autonomy [1, 2]. It is now widely accepted that AD, the most frequent form of dementia, is an increasingly serious worldwide health issue with far-reaching effects on both individuals and society [3]. AD is a complex and multifaceted disease caused by the interaction of genetic predisposition and lifelong environmental factors, and with genetic susceptibility accounting for approximately 70% of the risk of developing AD [4]. However, acquired factors such as cerebrovascular disease, diabetes mellitus, hypertension, obesity, dyslipidemia, infections and environmental factors all play a vital role in the development of AD [4, 5].
As an important environmental factor, ambient air pollution has been found to be closely related to AD [6, 7]. Ambient particulate matter 10 (PM10) refers to atmospheric particles having aerodynamic dimensions of less than or equal to 10 mm, which are among the most important air pollution indicators used to describe air quality, and PM10 exposure is a major threat to health and the environment worldwide [8, 9]. PM10 can enter the body through the respiratory tract, digestive tract, and skin due to its small size [8]. A large number of previous epidemiological or observational studies have shown that exposure to high concentrations of PM10 was significantly associated with the development of multiple chronic diseases, including AD [10, 11]. However, a systematic review and meta-analysis that included nine studies yielded inconclusive results [6]. To determine the causal effects of PM10 on AD using traditional epidemiological approaches may be difficult due to a number of potential biases, including sample size, residual confounding, insufficient follow-up time and reverse causation [12]. Of course, if a randomized trial was conducted in which individuals were randomly assigned to a certain level of PM10 over a period of years to represent AD risk, it might be possible to identify a causal relationship between PM and AD, but this would be highly unethical and impossible. Therefore, the causal relationship between PM10 and AD has remained unclear, and we need stronger evidence to support it.
In recent years, the emergence and use of the Mendelian randomization (MR) approach has provided vital help to solve the influence of potential confounding factors in observational and epidemiological studies [13, 14]. MR is a statistical model that employs genetic variation as an instrumental variable, and its principle is to replicate the random allocation process of research items by using the characteristics of random division and combination when gametes are created during the genetic variation process [14]. Furthermore, because allele assignment at meiosis is random and occurs before disease onset, the likelihood of confounding is low, and there is no concern about reverse causation [13]. To date, no MR study has explored a causal relationship between PM10 and AD. We conducted a two-sample multivariate MR study to assess the causal association between PM10 concentrations and the risk of AD in order to address the important gap in the literature regarding this research question.
Material and methods
Study design
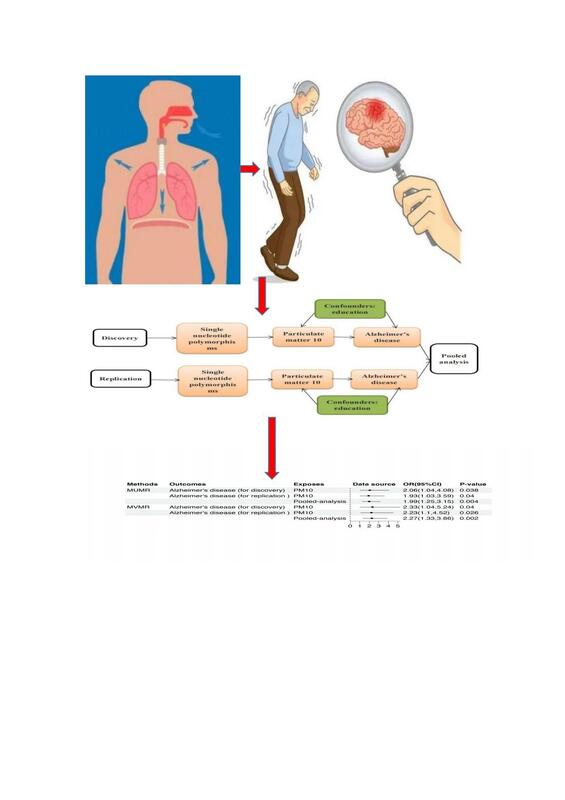
This was a two-sample multivariate MR study. It was carried out in accordance with the Mendelian Randomization Strengthening the Reporting of Observational Studies in Epidemiology Statement. Ambient PM10 was the exposure factor and AD was the outcome in the present study. The study process was divided into two steps, consisting mainly of univariate and multivariate MR, with a division into discovery and replication groups. Education was adjusted for in multivariate MR, given that education level was strongly associated with AD. In order to draw causal inferences from this MR study, three basic assumptions had to be met: (1) the genetic variants were significantly associated with PM10; (2) the genetic variants were not associated with potential confounders; (3) the genetic variants were not associated with AD except via the route of PM10. Figure 1 displays the conceptual diagram for the ongoing MR study. This analysis was approved by the Ethics Committee of Guangdong Provincial People’s Hospital (KY-Q-2021-244-01). The data used in this study were all summary-level data from publicly available data, so all informed consent and ethical approval were obtained in the original study.
Instrumental variable selection
All genetic variations that were significantly linked with PM10 were chosen as instrumental factors (p < 5 × 10⁻⁸). All included SNPs were clumped based on linkage disequilibrium (LD), which was defined as R2 < 0.001 and a clumping window greater than 10,000 kb. In the literature on instrumental variables, an F-statistic value greater than 10 is employed as a rule of thumb to support the relevance assumption. If an exposure SNP is not present in an outcome dataset, proxy SNPs with a minimum LD R2 value of 0.8 and a minor allele frequency (MAF) criterion for aligning palindromes of 0.3 should be used instead.
Assessment of ambient PM10
Annual average air pollution of PM10 was modelled for each address using a land use regression (LUR) model developed as part of the European Study of Cohorts for Air Pollution Effects (http://www.escapeproject.eu/). The LUR models calculated the spatial variation of annual average air pollutant concentrations at the participants’ home addresses using Geographic Information System-derived predictors such as traffic, land use and topography.
Data sources
All the summary-level genetic data for PM10 such as exposure, education as a confounding factor and corresponding outcome data for AD were from the IEU OpenGWAS database (https://gwas.mrcieu.ac.uk/). Summary-level genetic data for PM10 were obtained from UK Biobank (455314 individuals) with 9851867 SNPs. Summary-level data for AD were obtained from the EBI GWAS database with the trait of “ebi-a-GCST002245” (55134 individuals with 7022150 SNPs) and from the IEU OpenGWAS database with the trait of “ieu-b-2” (63926 individuals with 10528610 SNPs) for the discovery and replication group, respectively. Summary-level genetic data for education were obtained from the IEU OpenGWAS database (182286 individuals with 7643301 SNPs) with the trait of “ieu-a-1011”. All the data were from the European population. The detailed descriptions of included traits are summarized in Table I.
Table I
Summary of the included traits in the Mendelian randomization study
Statistical analysis and sensitivity analysis
Univariable and multivariable inverse-variance-weighted (IVW) methods were employed as the main analyses. In addition, as outcomes in the discovery and replication step were from different datasets, the MR outcomes were subjected to pooled meta-analysis by using a fixed effect model to obtain an overall causal estimate. In the multivariable MR analysis, we adjusted for education level (years of schooling) because education might be a vital factor in the associations of AD. In MR analysis, the IVW approach was extensively used to synthesize the effect derived from each instrument using the inverse variance. For each IV, the Wald ratio was used to estimate the effect of exposure on the outcome. In addition to IVW, the simple mode, MR-Egger, weighted median, MR-PRESSO, and weighted mode methods were utilized to enhance accuracy and stability. The MR estimates of the causative connection between PM10 and AD risk were reported as odds ratios (OR) and 95% confidence intervals (CI). Sensitivity analyses were performed using the leave-one-out test. Weighted mode technique was used as a sensitivity analysis as an alternative MR method based on different assumptions about horizontal pleiotropy. The IVW and MR-Egger methods were used to test for heterogeneity. MR-Egger regression accounted for horizontal pleiotropic effects and yielded unbiased causal effect estimates, despite the fact that the estimates were frequently underpowered. The MR-Egger regression could detect and compensate for potentially unbalanced pleiotropic effects, although it was often underpowered. Pleiotropy was shown by the p-value for the intercept in MR-Egger regression. After removing outliers, the MR-PRESSO approach could detect potential pleiotropic outliers and generate inverse-variance weighted estimates. To test for heterogeneity, Cochrane’s Q statistic was utilized, and the MR-Egger regression approach was used to find horizontal pleiotropy. If horizontal pleiotropy existed in IVs, the MR-Egger intercept was nonzero and statistically significant (p < 0.05). Scatter plots and forest plots were utilized to visualize the results. The effect of each SNP was demonstrated using forest plots. The forest plots also included MR-Egger analysis. To investigate the effect of each unique instrument on the total effect, a leave-one-out analysis was done. The statistical significance level of p < 0.05 was adopted. MR analysis was performed using R software (version 4.1.3, http://www.r-project.org), the R package TwoSampleMR version 0.5.5 (https://mrcieu.github.io/TwoSampleMR/), and the MR-PRESSO test was performed using the MRPRESSO package (https://github.com/rondolab/MRPRESSO).
Results
Selection of instrumental variables
According to the screening criteria for instrumental variables for PM10 related to AD in this MR study, 17 and 19 independent genetic variants were finally screened as instrumental variables in the discovery and verification groups, respectively. Information on the selected genetic variants, including SNP name, chromosome, effect allele, effect allele frequency and β coefficients, is presented in Table II.
Table II
Detailed information on genetic instruments associated with outcome for discovery and replication
Univariable MR analysis of PM10 level and AD
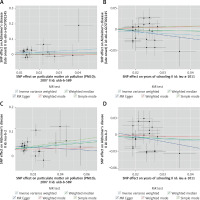
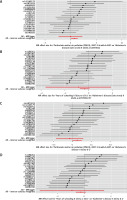
As shown in Figure 2, we found that each SD increase in the level of PM10 exposure was significantly associated with increased risk of AD in the discovery (Figure 2 A) and replication (Figure 2 C) step. However, each SD increase in the education level (years of schooling) was significantly associated with decreased risk of AD in the discovery (Figure 2 B) and replication (Figure 2 D) step. In addition, in the discovery and replication step, genetic predisposition to per SD increase of PM10 was significantly associated with a higher risk of AD (OR = 2.06, 95% CI: 1.04, 4.08; p = 0.038; and OR = 1.93, 95% CI: 1.03, 3.59; p = 0.040, respectively) in the primary IVW MR analyses (Figures 3 A, C), but showed that per SD increase of years of schooling was significantly associated with a lower risk of AD in the discovery and replication step (Figures 3 B, D, respectively). The results of other MR analyses, including weighted median, were consistent with the direction of the main IVW results (Table III). In addition, a pooled meta-analysis using fixed-effect IVW models showed that for genetically predicted per SD increase in the levels of PM10, the combined OR of discovery and replication was 1.99 (95% CI: 1.25, 3.15; p = 0.004) for AD (Figure 4).
Table III
Mendelian randomization assessing the causal association between exposures and Alzheimer’s disease
Figure 2
A scatter plot is used to visualize the causal effect between particulate matter 10 (PM100 and Alzheimer’s disease. A – Scatter plot visualizing the causal effect of PM10 on Alzheimer’s disease risk in the EBI GWAS database in discovery. B – Scatter plot visualizing the causal effect of education level on Alzheimer’s disease risk in the EBI GWAS database. C – Scatter plot visualizing the causal effect of PM10 on Alzheimer’s disease risk in the IEU OpenGWAS database in replication. D – Scatter plot visualizing the causal effect of education level on Alzheimer’s disease risk in the IEU OpenGWAS database in replication. The plot presents the effect sizes of the single nucleotide polymorphism (SNP)-PM10 or education level association (x-axis, SE units) and the SNP-Alzheimer’s disease association (y-axis, log (OR)) with 95% confidence intervals. The x-axis shows the SNP effect and standard error (SE) on each PM10 or education level. The y-axis shows the SNP effect and SE on Alzheimer’s disease. The regression slopes of the lines correspond to causal estimates using the five Mendelian randomization (MR) methods

Figure 3
Forest plot of PM10 associated with risk of Alzheimer’s disease. A – Forest plot of particulate matter 10 (PM10) on Alzheimer’s disease risk in the EBI GWAS database in discovery. B – Forest plot of education level on Alzheimer’s disease risk in the EBI GWAS database in discovery. C – Forest plot of PM10 on Alzheimer’s disease risk in the IEU OpenGWAS database in replication. D – Forest plot of education level on Alzheimer’s disease risk in the IEU OpenGWAS database in replication. The x-axis shows the MR effect size for PM10 or education level on Alzheimer’s disease. The y-axis shows the analysis for each of the single nucleotide polymorphisms (SNPs). Each black point represents the result of the IVW Mendelian randomization (MR) method applied to estimate the causal effect of each SNP on Alzheimer’s disease. Each red point depicts the IVW and MR-Egger estimate using all SNPs

Multivariable MR analysis of PM10 level and AD
In the discovery and replication step, genetic predisposition to per SD increase of education level (years of schooling) was significantly associated with a lower risk of AD (OR = 0.67, 95% CI: 0.45, 0.99, p = 0.047; and OR = 0.72, 95% CI: 0.49, 1.04, p = 0.078, respectively) in the primary IVW MR analyses. The results of other MR analyses, including MR-Egger, weighted median and MR-PRESSO, were consistent with the direction of the main IVW results (Table III). The causal estimate from the discovery and replication database showed about an 133% increase in odds of AD per SD higher PM10 (OR = 2.33; 95% CI: 1.04, 5.24; p = 0.04) and 123% increase in odds of AD per SD higher PM10 (OR = 2.23; 95% CI: 1.10, 4.52; p = 0.026) according to the IVW method (Figure 4). The pooled meta-analysis OR of discovery and replication by using fixed-effect IVW models was 2.27 (95% CI: 1.33, 3.86; p = 0.002) for AD after education was adjusted (Figure 4).
Pleiotropy, heterogeneity and sensitivity analysis
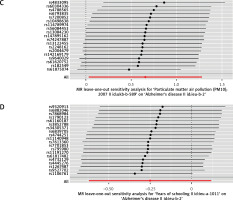
We used multiple MR methodologies, such as the simple mode, MR-Egger, weighted median, and weighted mode, to undertake sensitivity tests to improve the accuracy and stability of results. Table III shows the results of the causal association between PM10, education level, and AD of all four approaches in the discovery and replication step. As shown in Figures 5 A and C, we used the leave-one-out method to examine the impact of a single SNP on the results of MR analysis, and found that all IV calculations made these causal relationships significant, implying that there was no dominant IV for PM10 and AD, and that the two-sample MR results were valid in the discovery and replication steps, respectively, but that all IV calculations for education made these causal relationships non-significant in the discovery (Figure 5 B) and replication (Figure 5 D) steps. In the discovery and replication steps, neither the MR-Egger intercept nor the MR-PRESSO test revealed any significant pleiotropy (all p > 0.05). This meant that none of the SNPs affected AD via biological pathways unrelated to PM10 exposure. Furthermore, both MR-Egger and IVW had p > 0.05 in Cochran’s Q-test (Table III), demonstrating that none of the PM10 genetic variants had significant heterogeneity in the AD GWAS sample.
Figure 5
Leave-one-out sensitivity analysis for the effect of particulate matter 10 (PM10) on Alzheimer’s disease. A – Mendelian randomization (MR) leave-one-out sensitivity analysis of PM10 on Alzheimer’s disease risk in the EBI GWAS database in discovery. B – MR leave-one-out sensitivity analysis of education level on Alzheimer’s disease risk in the EBI GWAS database in discovery. C – MR leave-one-out sensitivity analysis of PM10 on Alzheimer’s disease risk in the IEU OpenGWAS database in replication. The x-axis showed MR leave-one-out sensitivity analysis for PM10 or education level on Alzheimer’s disease. The y-axis shows the analysis for the effect of leave-one-out of single nucleotide polymorphisms (SNPs) on Alzheimer’s disease. Each black point represents the result of the IVW MR method applied to estimate the causal effect of PM10 or education level on Alzheimer’s disease excluding a particular SNP from the analysis. Each red point depicts the IVW estimate using all SNPs. D – MR leave-one-out sensitivity analysis of education level on Alzheimer’s disease risk in the IEU OpenGWAS database in replication. The x-axis showed MR leave-one-out sensitivity analysis for PM10 or education level on Alzheimer’s disease. The y-axis shows the analysis for the effect of leave-one-out of single nucleotide polymorphisms (SNPs) on Alzheimer’s disease. Each black point represents the result of the IVW MR method applied to estimate the causal effect of PM10 or education level on Alzheimer’s disease excluding a particular SNP from the analysis. Each red point depicts the IVW estimate using all SNPs

Discussion
This two-sample MR study discovered that genetically predicted ambient PM10 levels may increase the risk of AD. According to the pooled meta-analysis, further multivariable MR analysis was undertaken to assess the causative effect of PM10 on AD, and the combined ORs for AD increased by 127% for each SD rise in PM10 levels after adjustment for education level. Furthermore, the sensitivity analysis approach of the leave-one-out method produced consistent results, with no heterogeneity or horizontal pleiotropy, indicating that our conclusion was valid.
AD and PM10 have been linked in previous observational studies, but their results have been controversial [15–18]. According to a Taiwanese epidemiological investigation, long-term exposure to PM10 was linked to a higher prevalence of AD [16]. Similarly, a German epidemiological study found a strong link between PM10 exposure and the prevalence of AD [15]. However, a longitudinal cohort study from Rome drew the opposite conclusion [17] and a cohort study from the UK-Biobank found no significant association between them [18]. The reason for this difference in results may be that the PM10 concentration or study design was different, the follow-up time was not long enough or the sample size was not large enough, and the potential confounding variables could not be adjusted for. In our MR study, both in the discovery and validation groups and in the pooled meta-analysis, we found that higher PM10 concentrations were significantly associated with increased risk of AD. Similarly, both univariate and multivariate MR analyses showed a strong correlation between PM10 and the prevalence of AD. Additionally, sensitivity analysis revealed that a higher risk of developing AD was connected to a higher PM10 concentration. These findings indicated a strong causal relationship between genetic variation in PM10 and increased AD risk. As a result, increasing air quality and lowering PM10 concentrations could significantly reduce the risk of AD.
The exact mechanism by which PM10 increased the risk of AD occurrence is still unclear. On the one hand, the main reason may be that long-term exposure to PM10 could lead to pathological amyloid-β deposition [19]. It is currently recognized that AD is characterized by deposition of amyloid-β plaques and neurofibrillary tangles in the brain, and increasing evidence suggests that amyloid-β plays a significant role in AD pathogenesis, possibly as an upstream molecule incorporating both genetic and environmental variables [20, 21]. On the other hand, it has been confirmed that air pollution has an important impact on mouse brain due to accelerated myelin and neuritic aging changing with specificity for cornu ammonis area 1 neurons related to AD [22]. In addition, air pollution has been related to several health effects including oxidative stress and neuroinflammation, which may ultimately result in neurodegeneration and cognitive impairment linked to AD [23, 24]. Finally, studies have indicated that exposure to ambient air pollution may increase the risk of cardiovascular metabolic diseases, including diabetes, hypertension, and obesity [10, 25–27]. Hypertension, diabetes and obesity were among the modifiable risk factors for AD [5, 28]. In the future, more basic studies are needed to clarify the potential relationship between atmospheric PM and AD.
Our research has some advantages. First, the multivariable MR study was the first to examine the causal relationship between PM10 and AD from a genetic perspective since it could remove the influence of confounding factors related to observational studies. Second, this study used a large sample size and the pooled meta-analysis methodology, so the results were reliable. Third, various methodologies were used to validate the stability and consistency of the outcomes, so the results were robust. Our research has significant limitations. To begin with, the results of this study cannot be extended to other groups because all of the subjects involved were of European descent. Second, although using multivariate MR, we only accounted for one educational factor that was highly significant for AD. Third, there were no new experimental conclusions or other generalizable developments, and no relevant experiments or mechanism exploration was carried out. Additionally, we used aggregated AD-related GWAS data, making subgroup analysis, e.g. by gender and age, impossible. Furthermore, despite the lack of pleiotropy and heterogeneity, several methods were not statistically significant, indicating that additional research is required in the future. Finally, it is well known that there are many different types of ambient PM in the atmosphere, but only PM10 was analyzed in the present study.
In conclusion, our two-sample multivariable MR study found that higher ambient PM10 concentrations significantly increased the incidence of AD. Our findings may have public health consequences since they raise awareness of the extent to which air quality is linked to the risk of AD. This finding could also help in the prevention of AD and enhance the role of air pollution control in the development of AD. However, to confirm the validity of the findings from this study, additional experimental and mechanistic research is needed in the future.


