Introduction
Vitamin D, essential for maintaining calcium and phosphorus balance, is naturally synthesized in the skin through sunlight exposure and found in limited quantities in food. However, insufficient sunlight exposure or dietary intake can lead to vitamin D deficiency. In the US, approximately 70% of children and adolescents aged 1 to 21 years suffer from vitamin D deficiency or insufficiency (< 75 nmol/l) [1]. Epidemiological evidence suggests that this insufficiency in adolescents may be linked to various health issues, including hypertension, hyperglycemia, metabolic syndrome [2], respiratory infections [3], and allergies [4, 5], with a notable impact on cardiovascular health (CVH) [6].
The American Heart Association (AHA) introduced the Life’s Simple 7 concept in 2010 to shift focus towards promoting health rather than merely treating diseases [7]. Recognizing its limitations, AHA specialists later refined this to Life’s Essential 8, encompassing health behaviors and factors [8]. These measures correlate inversely with cardiovascular disease (CVD), CVD mortality, and all-cause mortality [9–11]. Importantly, cardiovascular risk factors in adolescents not only influence adult CVD incidence but also highlight that early intervention in CVH can significantly improve long-term outcomes [12].
While existing research predominantly examines the link between vitamin D levels and cardiovascular events after their occurrence [13, 14], our study aims to determine the optimal serum vitamin D concentrations for maintaining CVH in adolescents prior to adverse cardiovascular events. This approach could provide a reference for future cardiovascular disease prevention and treatment, addressing a critical gap in current research. We used the latest CVH scoring criteria to elucidate the relationship between serum vitamin D concentrations and CVH in adolescents.
Material and methods
Data source and participants
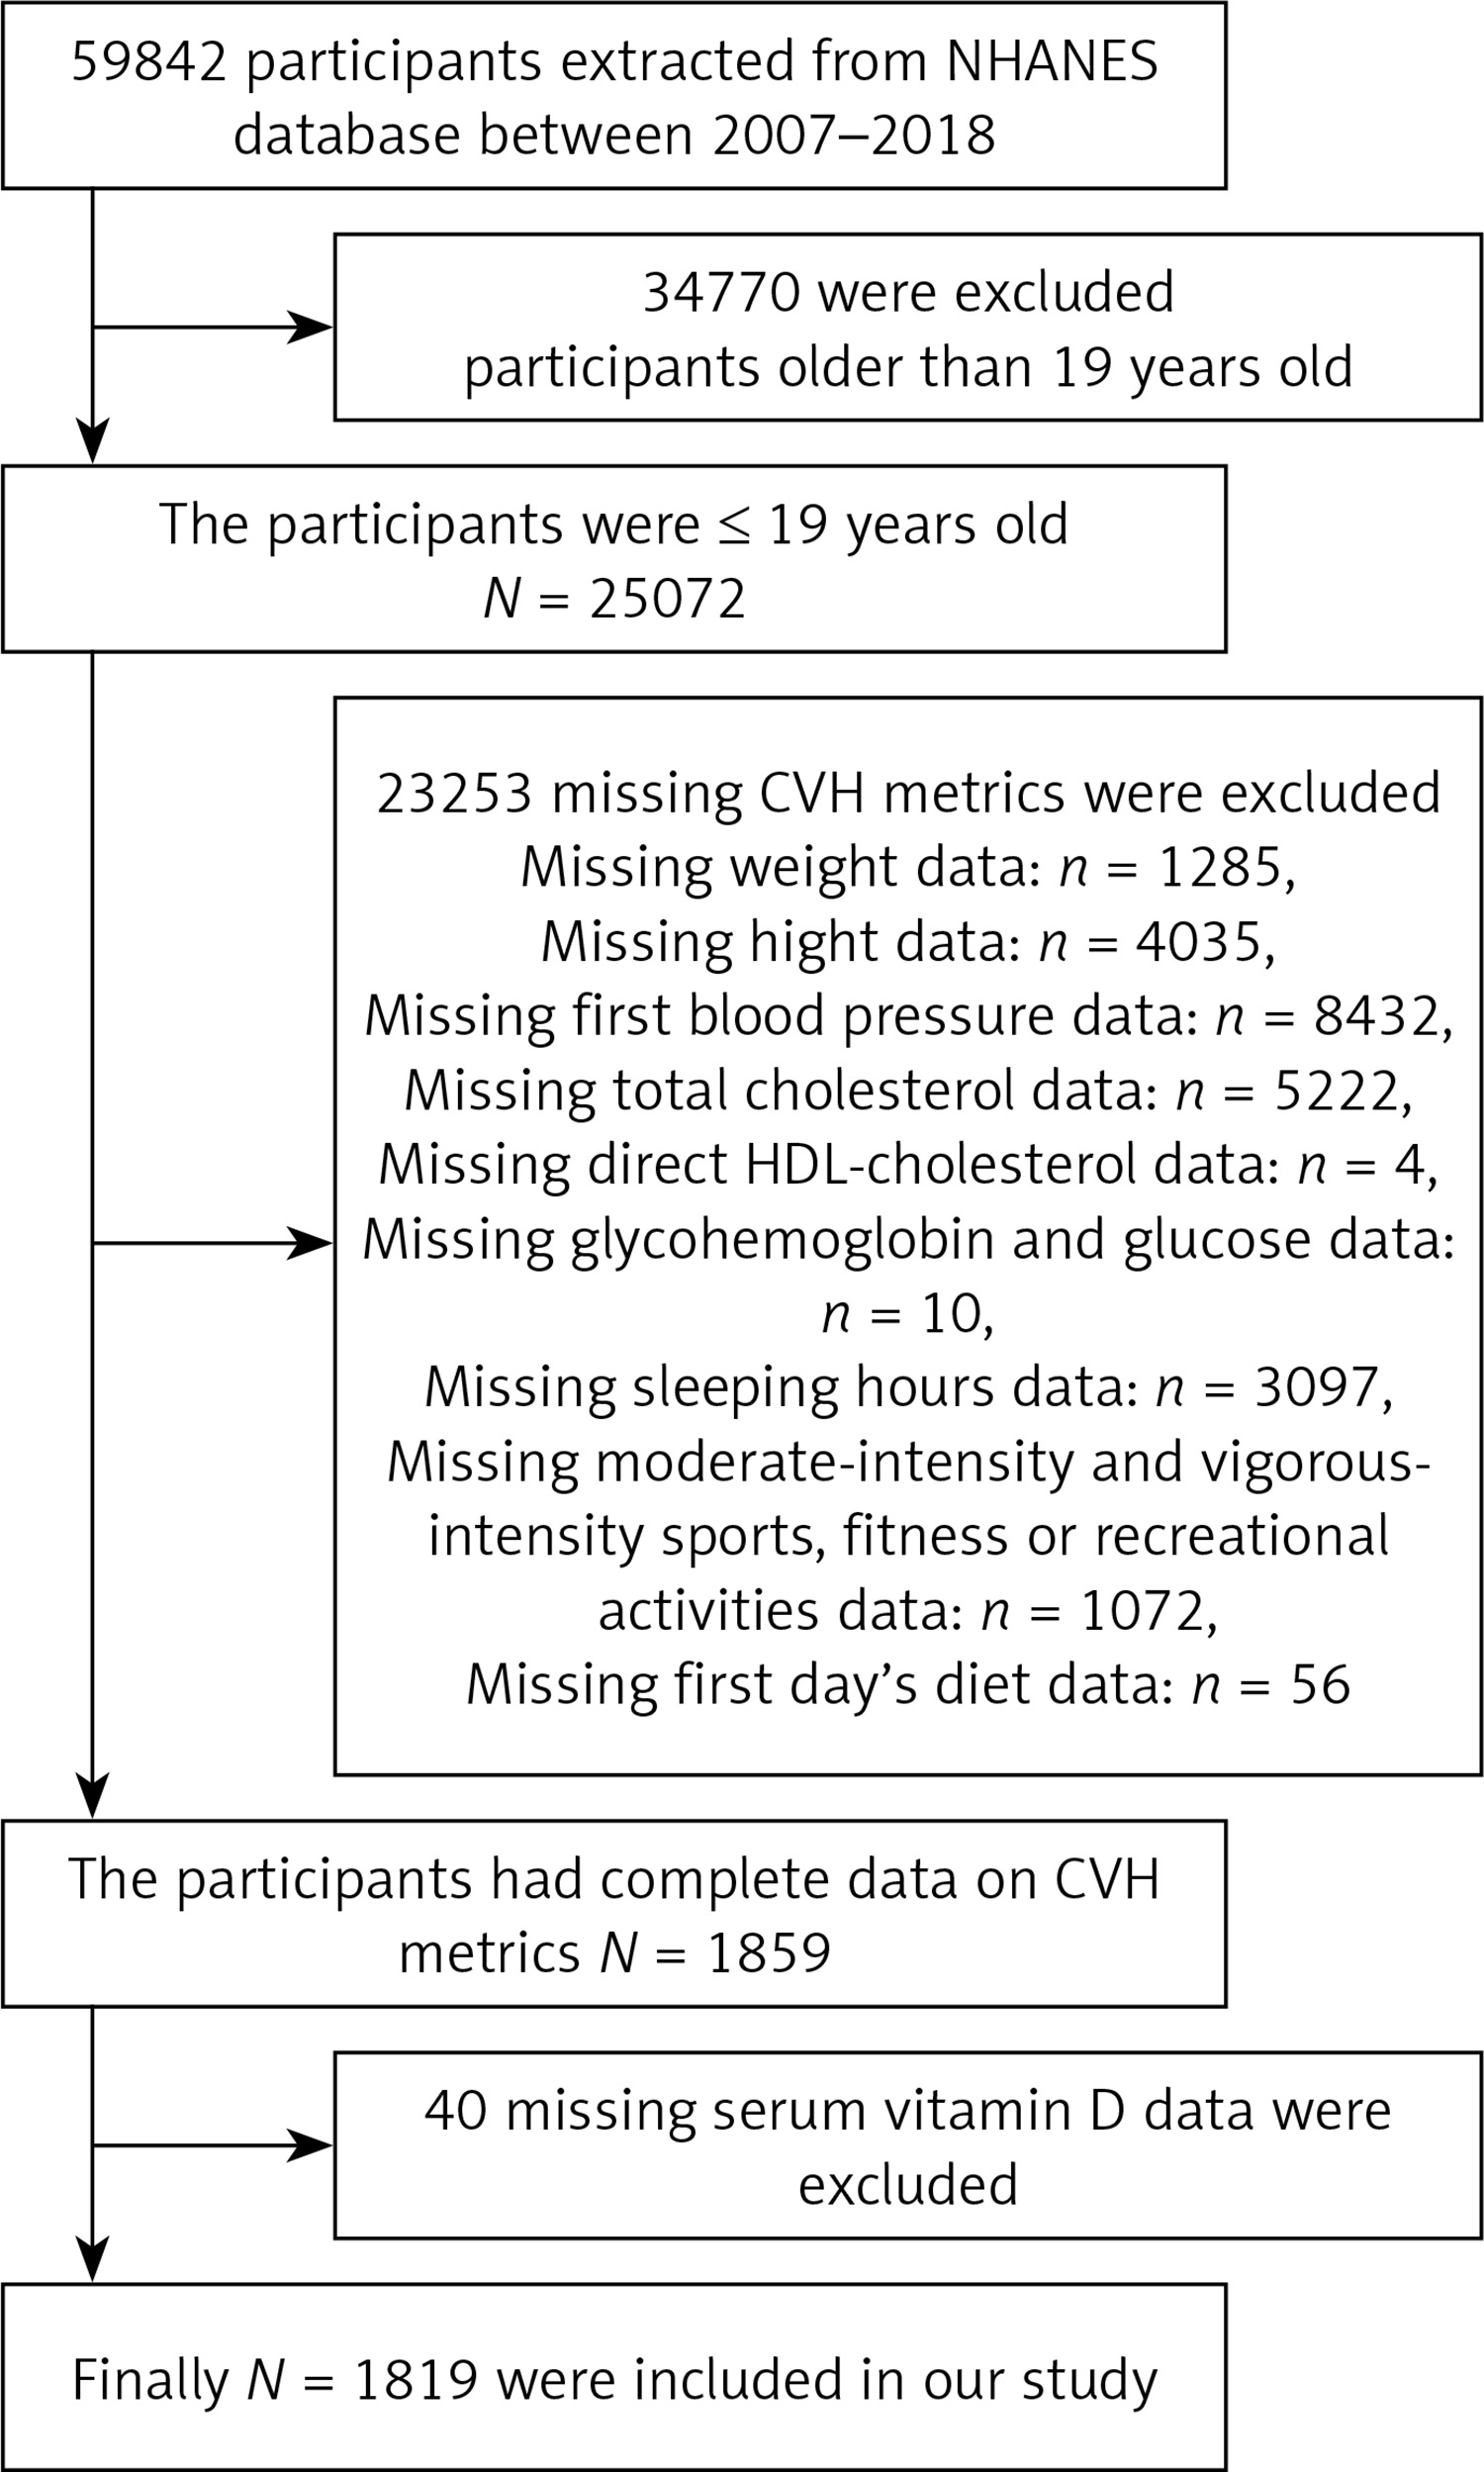
The National Health and Nutrition Examination Survey (NHANES) is a research initiative conducted by the National Center for Health Statistics (NCHS) to measure national health and nutrition. It collects data using a complex, stratified, multistage sampling approach with the goal of analyzing the health and nutrition status of adults and children in the United States. We aggregated data from the 6 survey cycles (2007–2018) for analysis. A total of 59,842 persons of all ages were registered for NHANES interviews from 2007 to 2018. From these, we removed individuals above the age of 19 (n = 34,770), those who had any missing information for the components of Life’s Essential 8 (diet, physical activity, sleep health, body mass index, blood lipids, blood glucose, and blood pressure; n = 23,213), and those who had missing serum vitamin D concentration data (n = 40). Our final sample for analysis included a total of 1,819 individuals aged 16–19 years. Figure 1 depicts the comprehensive inclusion and exclusion procedure. The Declaration of Helsinki’s guiding principles were followed when conducting this study. The Centers for Disease Control and Prevention (CDC) and the NCHS Ethics Review Board authorized the survey procedure, and all participants provided signed informed permission.
Measurement and classification of serum vitamin D concentrations
The National Center for Environmental Health at the CDC in Atlanta, Georgia, received the serum samples which had been collected, stored, and sent for analysis. In the current investigation, total serum vitamin D concentrations were measured using standardized liquid chromatography-tandem mass spectrometry (LC-MS/MS) or expressed as LC-MS/MS equivalent values (depending on the NHANES campaign), as recommended by the CDC. It is important to note that vitamin D comprises both vitamin D2 and vitamin D3. The results were reported in SI units (nmol/l) [15].
We established several vitamin D statuses using the cut-off points specified in the most recent Global Consensus Recommendations [16]. We classified serum vitamin D concentrations into the following three categories: (1) sufficiency, serum vitamin D 50–250 nmol/l; (2) insufficiency, serum vitamin D 30–50 nmol/l; and (3) deficiency, serum vitamin D < 30 nmol/l.
CVH metrics
The foundation for CVH metrics was laid by the Life’s Essential 8 metrics, developed by the AHA and including diet, physical activity, nicotine exposure, sleep health, body mass index, blood lipids, blood glucose, and blood pressure. Trained health technicians recorded the body measurement data at the Mobile Examination Center. A mercury sphygmomanometer was used to compute the systolic and diastolic blood pressures based on a maximum of four readings. If more than one measurement was obtained, the average of the remaining measurements was used instead of the first measurement. Otherwise, the first measurement was used. Direct HDL-cholesterol was measured by immunoassay. Plasma glucose and total cholesterol levels were assessed by the enzymatic method. The Diabetes Diagnostic Laboratory used Primus CLC 330 and Primus CLC 385 instruments to quantify glycohemoglobin. The Global Physical Activity Questionnaire served as the foundation for the physical activity survey. Participants self-reported their average weekday or workday sleep length. Dietary intake data were evaluated using up to two 24-hour dietary recalls and the Nutrition Database for Dietary Studies. The scoring algorithms for each statistic are displayed in Supplementary Table SI. In this study’s primary analysis, records on the nicotine-delivery system in the nicotine exposure scoring criteria were excluded from the total score for the sake of the accuracy of the score, as they were only counted after 2013. The unweighted mean of the scores for each of the 7 component metrics (with the exception of nicotine exposure score) was used to compute the aggregate score, which ranged from 0 to 100 points. Scores of 0 to 49 were classified as low CVH, 80 to 100 as moderate CVH, and 50 to 79 as high CVH. The primary outcome variables in our study are the summaries of the 7-component CVH metrics scores as a continuous variable or categorized into 3 ranges (high, moderate, and low).
Other covariates
The covariates were chosen based on prior research and empirical analysis. The demographic and other covariates that were self-reported included sex, age, race and ethnicity (Mexican American, non-Hispanic white, non-Hispanic black, and other), the education level of the household reference person (less than high school, high-school graduate, and college or above), alcohol consumption and the family poverty-income ratio (PIR, classified into ≥ 1.30 and < 1.30). A greater PIR indicates more family income per capita, whereas a PIR of less than 1.3 denotes poverty. Refer to Supplementary Table SII for a comprehensive breakdown of the variables from the NHANES questionnaire utilized in this research.
Statistical analyses
Normally distributed continuous variables are expressed as means and standard deviations in descriptive analysis, whereas categorical variables are expressed as proportions; nonnormally distributed continuous variables are expressed as medians (interquartile ranges (IQR)), and categorical variables are expressed as counts and proportions. Baseline characteristics were compared across CVH metric category subgroups using the χ2 test, analysis of variance and Kruskal-Wallis test. Univariable and multivariable linear regression analyses were used to assess the associations between serum vitamin D concentrations and CVH scores. The odds ratios (ORs) and 95% confidence intervals (CIs) for the correlation between serum vitamin D concentrations and CVH category scores were calculated using logistic regression models. Subsequently, restricted cubic spline and threshold saturation effect analyses were performed. Age, sex, race, family PIR, alcohol consumption, and the household head’s level of education were all taken into account when the multivariate model was adjusted. The heterogeneity within subgroups is represented as a forest plot in the subgroup findings, and it was determined by fitting an interaction between treatment and subgroup. Moreover, the discriminatory ability of serum vitamin D concentrations indicating insufficiency or deficiency (< 50 nmol/l) in identifying poor CVH risk was assessed using receiver operating characteristic (ROC) curves.
In the case of categorical variables, the missing values were imputed as the most frequent value among those with data. Missing values were imputed as “college or above” for the categorical variable educational attainment of the household head, for example. The missing values for continuous variables were imputed as the median.
All analyses were performed using R Statistical Software (Version 4.3.1, http://www.R-project.org, The R Foundation) and the Free Statistical analysis platform (Version 1.9, Beijing, China). A two-tailed test was used, and a result was considered statistically significant when the p-value was < 0.05.
Results
Baseline characteristics
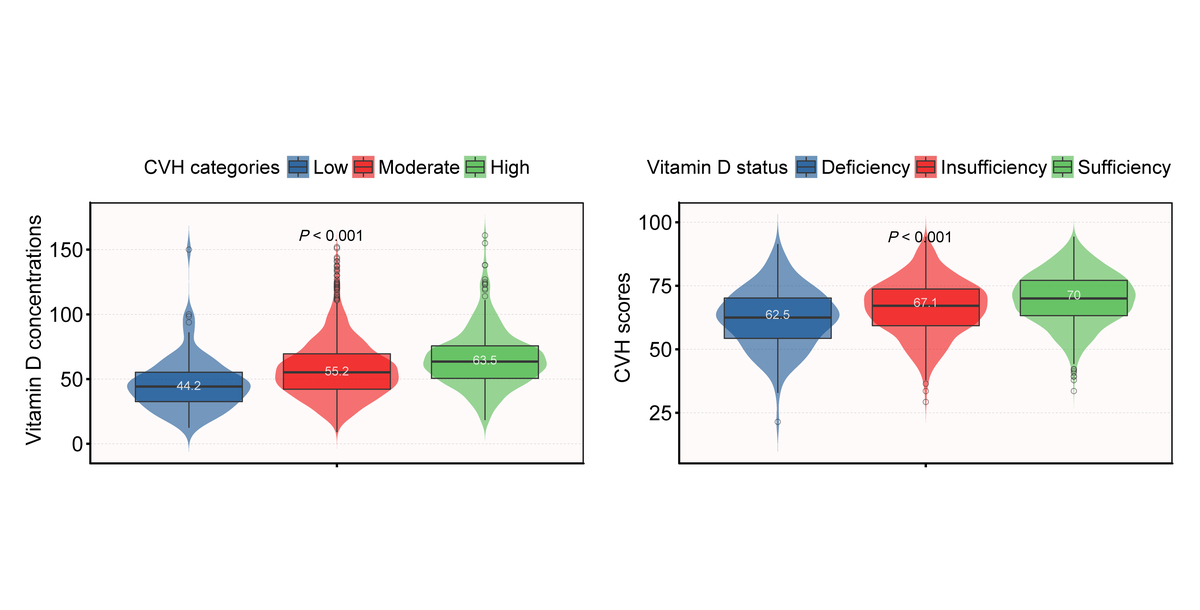
Table I lists the baseline characteristics all participants. The mean age of the 1819 adolescents was 17.4 ±1.1 years. 59.3% were male, 22.7% were Mexican American, 29.9% were non-Hispanic White, 23.7% were non-Hispanic Black, 75.6% had a PIR of ≥ 1.3, and 49.9% of their parents had a college education or above. With substantial differences between the groups, serum vitamin D concentrations were 58.4 ±22.8 nmol/l in the low CVH group, 46.1 ±21.0 nmol/l in the moderate CVH group, and 66.1 ±22.7 nmol/l in the high CVH group. Younger age, non-Hispanic white ethnicity, a higher PIR, and a higher serum vitamin D concentration or sufficient vitamin D status were associated with higher CVH scores (Table I).
Table I
Baseline characteristics of participants classified by CVH categories
Association between serum vitamin D concentrations and CVH scores
In univariate analysis, the CVH score increased by 0.11 points for each 1 nmol/l increase in serum vitamin D concentrations (p < 0.001); the CVH score for inadequate vitamin D status was 4.09 points higher than that of deficient vitamin D status (p < 0.001); and the CVH score for adequate vitamin D status was 7.82 points higher than that of deficient vitamin D status (p < 0.001).
In the multivariate model, the CVH score increased by 0.12 points for each 1 nmol/l increase in serum vitamin D concentration (p < 0.001); the CVH score for inadequate vitamin D status was 3.66 points higher than for the deficient vitamin D status (p < 0.001); and the CVH score for the adequate vitamin D status was 7.36 points higher than for the deficient vitamin D status (p < 0.001) (Table II).
Table II
Association between serum vitamin D and CVH score
After adjusting for these possible factors related to CVH, including age, sex, race, family PIR, alcohol consumption, and the educational attainment of household head, a nonlinear relationship between serum vitamin D concentrations and CVH score was observed (Figure 2). The threshold saturation effect in particular showed that there was an inflection point at 86 nmol/l for serum vitamin D concentrations (Table III). After adjusting for the aforementioned potential confounders, we discovered that serum vitamin D concentrations were positively associated with CVH scores below the inflection point’s threshold (serum vitamin D concentrations < 86 nmol/l) (adjusted-β = 0.17; 95% CI: 0.135–0.206; p < 0.001). In contrast, CVH scores were not related to serum vitamin D concentrations above this inflection point (serum vitamin D concentrations ≥ 86 nmol/l) (β = –0.058; 95% CI: –0.158–0.042; p = 0.253).
Figure 2
Association between serum vitamin D concentrations and CVH score β-coefficients. Solid and dashed lines represent the predicted value and 95% confidence intervals. Only 95% of the data are displayed. They were adjusted for sex, age, race, family poverty-income ratio, alcohol consumption and educational attainment of household head
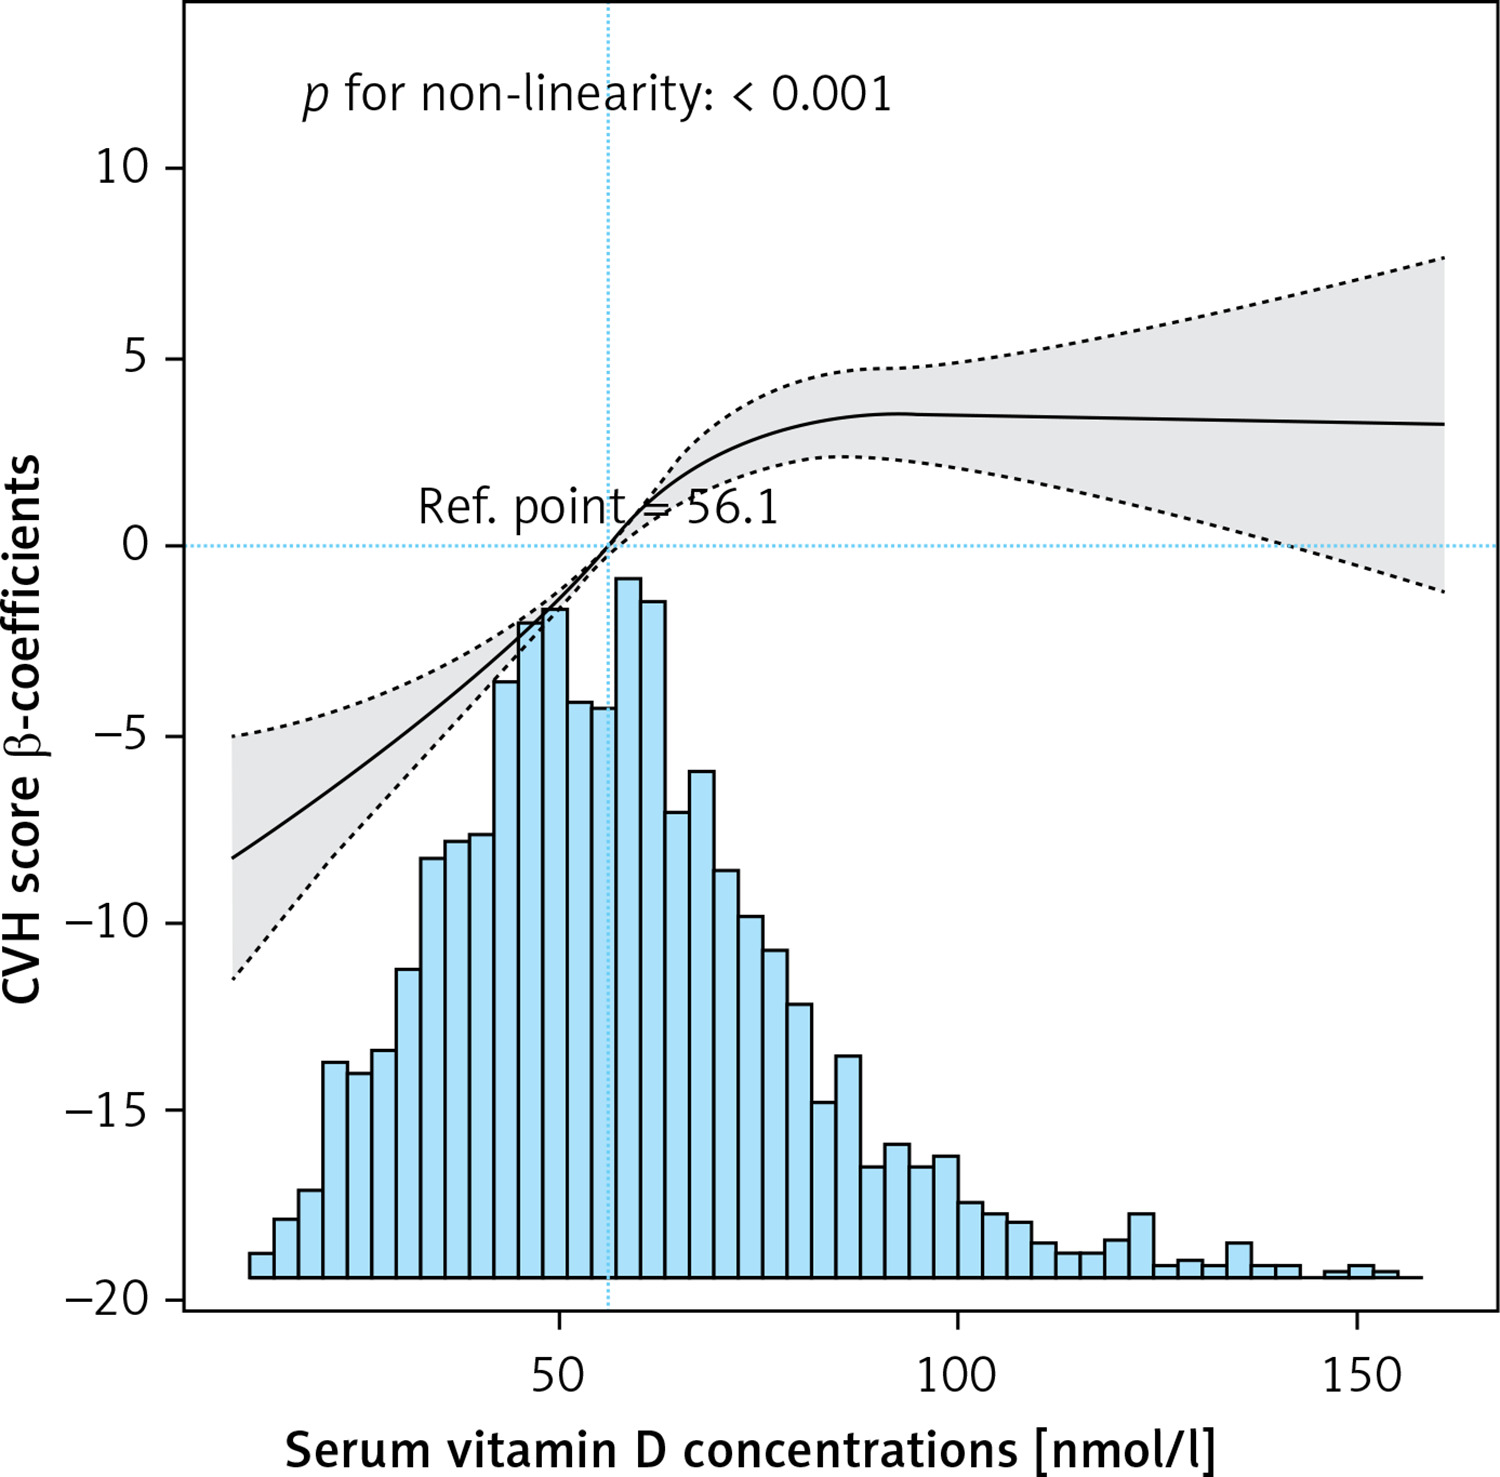
Table III
Threshold effect analysis of the relationship between serum vitamin D concentrations and CVH scores
| Serum vitamin D concentrations [nmol/l] | Adjusted model | |
|---|---|---|
| β (95% CI) | P value | |
| < 86 | 0.17 (0.135–0.206) | < 0.001 |
| ≥ 86 | –0.058 (–0.158–0.042) | 0.253 |
| Logarithmic likelihood ratio test p-value | < 0.001 | |
Supplementary Table SIII shows the association of serum vitamin D concentrations and different vitamin D statuses with CVH. According to the unadjusted model, there was a 3% risk increase for moderate CVH and a 5% risk increase for high CVH for every 1 nmol/l rise in serum vitamin D concentration. This significant relationship was also present in the adjusted model when serum vitamin D was transformed into a categorical variable (all p-values < 0.05). The adjusted ORs for moderate versus low CVH were 1.97 (95% CI: 1.12–3.45) and 4.72 (95% CI: 2.64–8.42), respectively, comparing vitamin D sufficiency and insufficiency to vitamin D deficiency. The corresponding ORs for high versus low CVH were 3.18 (95% CI: 1.36–7.43) and 13.94 (95% CI: 6.03–32.19), respectively. Each 1 nmol/L increase in serum vitamin D concentration was linked to a 3% increase in the chance of developing moderate CVH and a 4% increase in the risk of developing high CVH after adjusting for sex, age, race, family poverty-income ratio, and educational level of household head.
Comparing status of vitamin D insufficiency and status of vitamin D sufficiency to status of vitamin D deficiency, the adjusted ORs for moderate versus low CVH were 1.89 (95% CI: 1.05–3.4) and 4.11 (95% CI: 2.09–8.11), respectively. The corresponding ORs for high versus low CVH were 2.56 (95% CI: 1.06–6.17) and 9.23 (95% CI: 3.64–23.38), respectively.
Stratified analyses based on additional variables
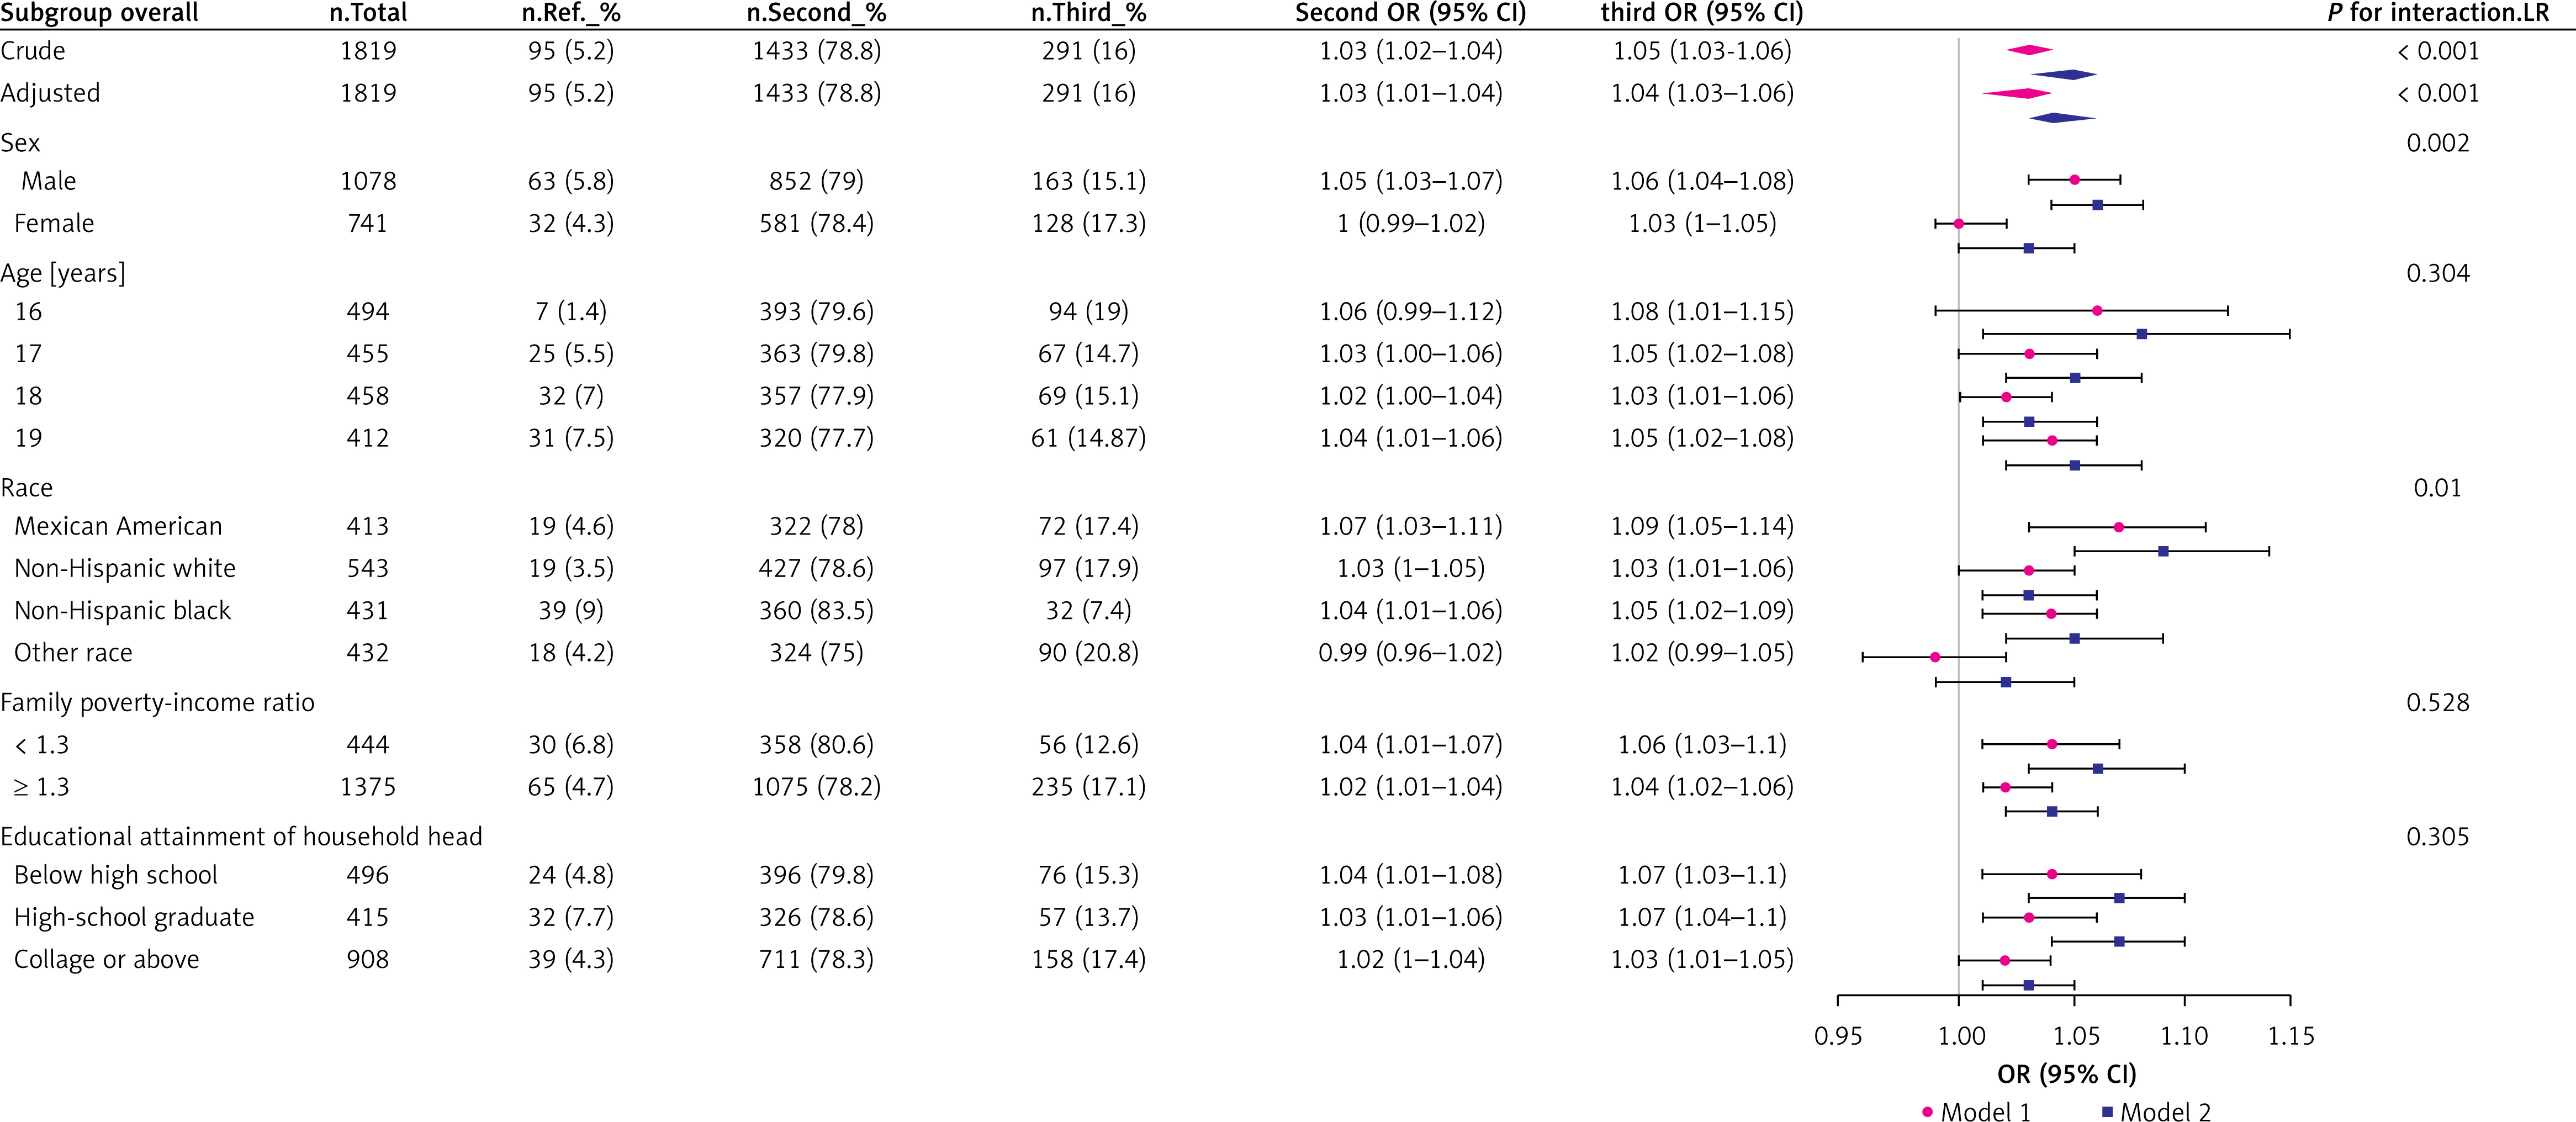
The forest plot in Figure 3 demonstrates that associations between serum vitamin D concentrations and CVH categories were generally consistent across age, family poverty-income ratio, and educational attainment of household head subgroups, but that this correlation was stronger in the male, Mexican American, and non-Hispanic Black sex and racial subgroups.
Figure 3
Subgroup analysis of the association between serum vitamin D concentrations and CVH category scores. Each stratification was adjusted for sex, age, race, family poverty-income ratio, alcohol consumption and educational attainment of household head except the stratification factor itself. Squares and circles indicate odds ratios (ORs), with horizontal lines indicating 95% CIs. Diamonds indicate overall ORs, with outer points of the diamonds indicating 95% CIs
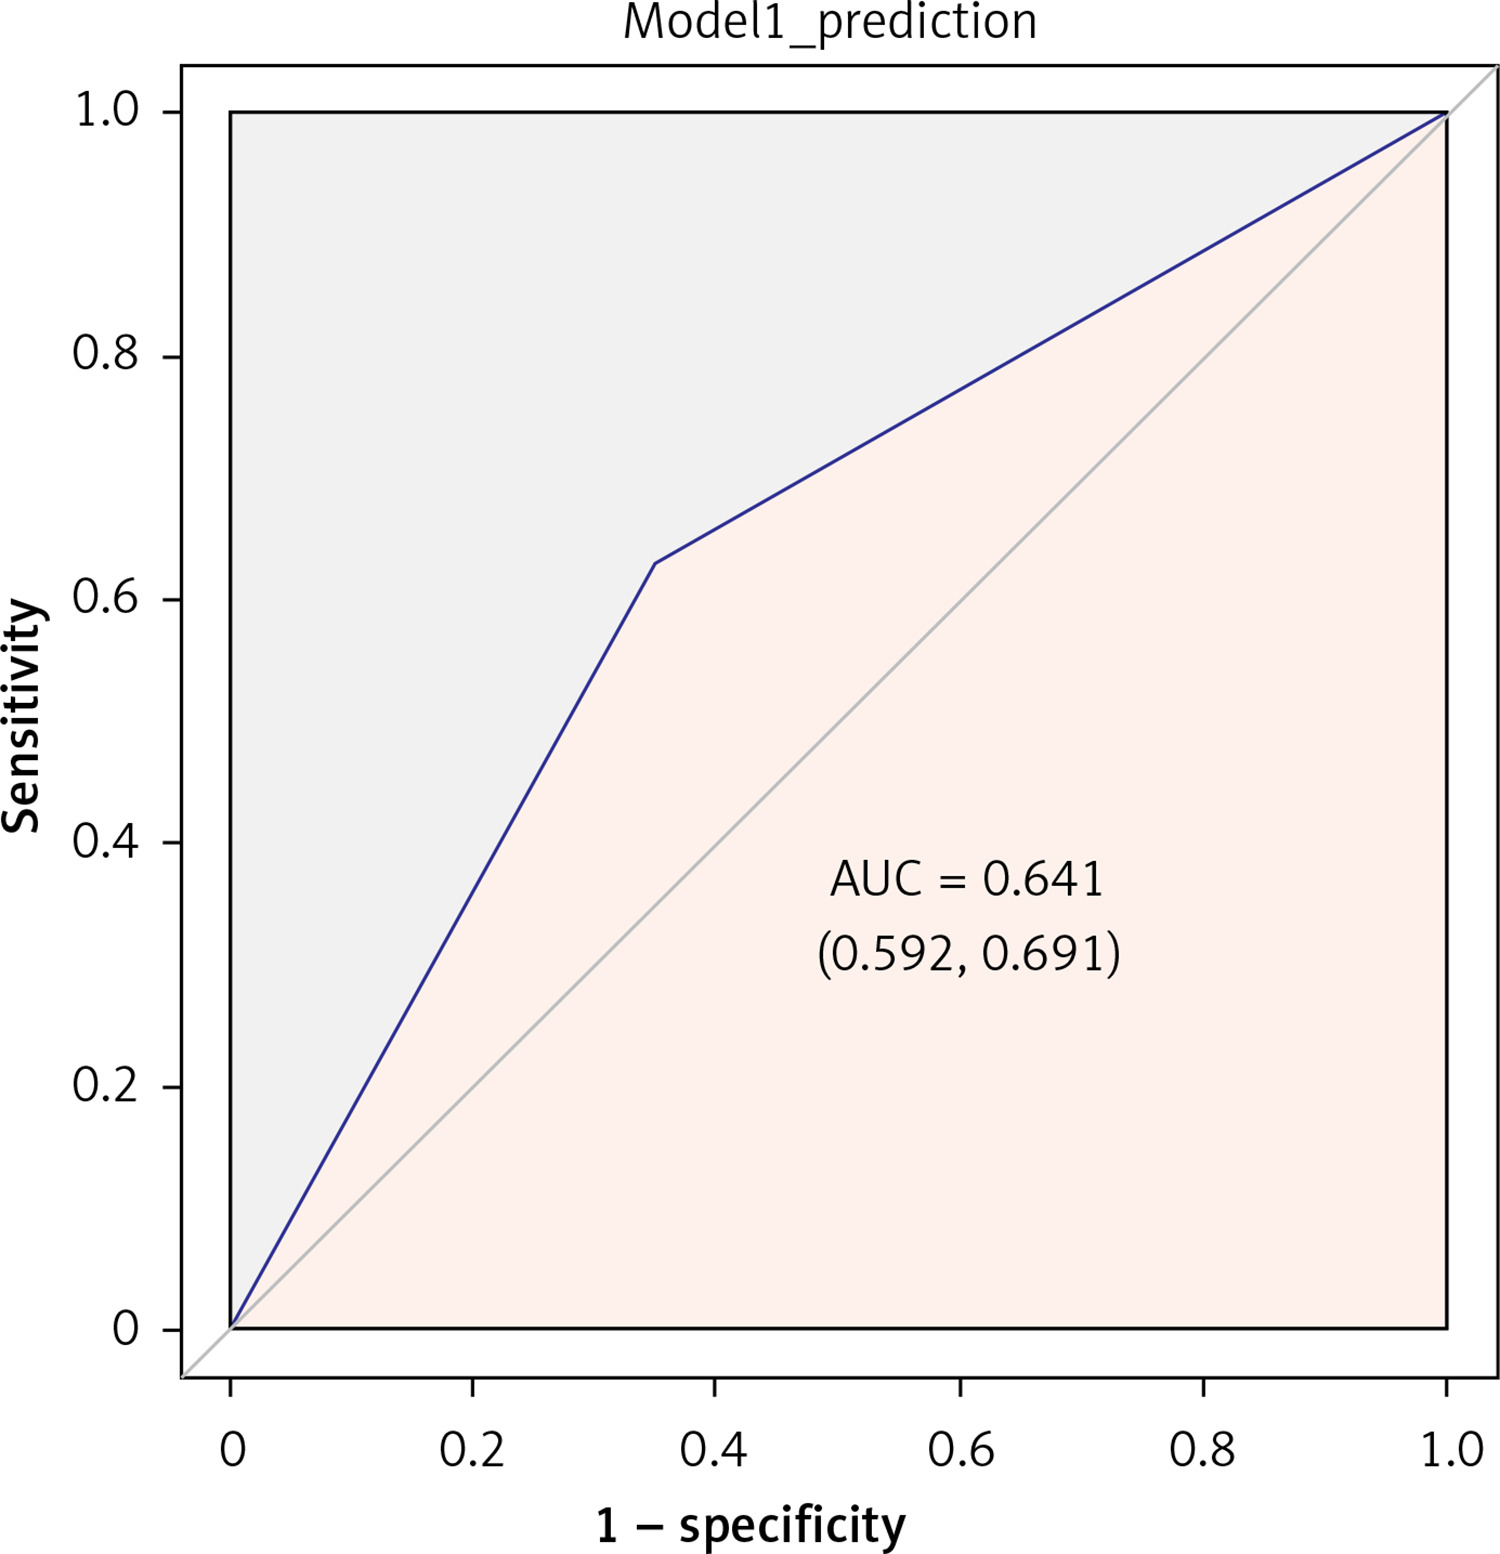
ROC analysis of serum vitamin D concentrations in identifying CVH risk
We performed ROC analysis to evaluate the discriminatory capacity of serum vitamin D concentrations, particularly those indicating insufficiency or deficiency (< 50 nmol/l), in identifying individuals at low CVH risk. The analysis revealed a moderate discriminatory performance, with an area under the curve (AUC) of 0.641 (95% CI: 0.592–-0.691), as depicted in Figure 4.
Discussion
This study offers preliminary insights into the association between serum vitamin D levels and CVH in adolescents, using the AHA’s LE8 scoring tool. This novel application of the LE8 tool enhances our understanding of CVH, expanding upon the foundational criteria established by the original LS7.
Vitamin D, a crucial steroid hormone, has been shown to significantly affect global child and adolescent health [17]. Our findings of a high prevalence (36.4%) of vitamin D deficiency in US adolescents aged 16–19 years align with global trends. This deficiency is likely influenced by modern indoor lifestyles and dietary choices favoring ultra-processed foods over natural sources rich in vitamin D [18]. Such lifestyle factors, crucial for natural vitamin D synthesis through skin exposure to sunlight, underscore the need for public health interventions. Importantly, our analysis reveals that CVH scores improve incrementally with increases in vitamin D levels, suggesting a potential correlation between vitamin D concentrations and CVH. Additionally, serum vitamin D levels exhibit commendable discriminatory power in identifying low CVH risk. This finding is supported by previous studies linking vitamin D deficiency to increased risks of myocardial infarction, left ventricular hypertrophy, heart failure, and mortality [13]. Vitamin D’s influence on cell division, the renin-angiotensin-aldosterone system, anti-inflammatory and anticoagulant effects, and overall cardiovascular homeostasis further reinforces our hypothesis [19]. Furthermore, the cardioprotective effects of vitamin D may also involve its regulation of metabolic pathways, particularly through the action of the vitamin D receptor (VDR) [20]. Recent studies indicate that genetic variations in the VDR gene can affect the expression, post-translational processing, functionality, and vitamin D binding capacity of this receptor, thereby indirectly influencing CVH [21]. These genetic variations are associated with risks for type 2 diabetes, metabolic syndrome, as well as overweight and obesity – conditions known to elevate the risk of cardiovascular diseases [22–24]. For instance, a study showed that obese subjects with 25(OH)D < 31 nmol/l compared to those with 25(OH)D ≥ 31 nmol/l had statistically significant higher levels of hs-CRP and sE-selectin, as well as higher BMI and 2hPG [25]. It was also shown that endothelial dysfunction was associated with vitamin D deficiency and increased risk of arterial hypertension, which has gained clinical significance, especially during the COVID-19 pandemic, considering COVID-19 an endothelial disease. These postulates are further supported by a cross-sectional study that highlighted this intriguing connection by demonstrating that severely vitamin D deficient patients were more likely to have hypertension than patients with 25(OH)D levels above 30 nmol/l, which may lead us to the conclusion that severe vitamin D deficiency may play a significant role in the synergy of the influence of other cardiometabolic risk factors, both in COVID-19 and in numerous different diseases, implying a potentially broad morbidity impact of vitamin D deficiency [26]. Given the results of the observational studies mentioned and our study’s findings, the importance of further research into the role of vitamin D is clear. It is necessary to conduct well-designed randomized clinical trials, in order to develop preventive strategies targeting this modifiable risk factor. A novel aspect of our study is the differential impact of vitamin D across demographic groups. We observed stronger correlations between vitamin D levels and CVH scores in male, Mexican, and non-Hispanic Black adolescents, consistent with previous findings [27]. This suggests a potential vulnerability to cardiovascular diseases in these groups when faced with low serum vitamin D levels, perhaps due to distinct biological mechanisms [28–30]. Further research is needed to explore these differences more deeply. The discovery of a non-linear association between serum vitamin D concentrations and CVH scores is particularly intriguing. The identification of a saturation point at 86 nmol/l for vitamin D’s protective effect on CVH in adolescents is a critical finding. This suggests that maintaining serum vitamin D concentrations around this level is optimal, negating the need for excessive supplementation. Similar findings have been reported in studies focusing on the relationship between vitamin D levels and cardiovascular disease mortality, supporting our observed saturation point [31]. However, it is crucial to consider the potential risks associated with very high levels of vitamin D. Studies have linked serum vitamin D concentrations above 140 nmol/l to increased all-cause mortality [32], a finding not explored in our study due to the exclusion of extreme vitamin D concentration data. This highlights the importance of maintaining balanced vitamin D levels.
Furthermore, a large-scale randomized controlled trial showed that vitamin D supplementation did not significantly reduce cardiovascular event risks [33]. This discrepancy might be explained by the multifactorial nature of CVH, where vitamin D levels represent just one aspect of a healthy lifestyle. Effective cardiovascular outcomes require a holistic approach, not just vitamin D supplementation. In conclusion, our study emphasizes the importance of maintaining adequate vitamin D levels for optimal CVH in adolescents, especially in specific high-risk groups. Regular monitoring of serum vitamin D concentrations is vital for predicting and managing CVH.
This study has various advantages. First, we assembled a sizable group of teenagers from the US. Second, survey methods and quality assurance could be used to guarantee the accuracy of the NHANES data. Our study does, however, have certain drawbacks. First, as the NHANES cycle is continuous and cross-sectional, causality cannot be inferred, and it is also impossible to evaluate how CVH has changed over time for each individual. Second, NHANES lacks statistical information on nicotine exposure prior to 2013, so data related to nicotine exposure were not included in this study, and CVH scores may not represent the true CVH status of each individual. However, based on the limited information available from the AHA Presidential Advisory, such a calculation is still reasonable and feasible. Thirdly, residual confounding effects from unmeasured or unknown factors cannot be ignored even though a number of covariates were accounted for in the regression models. Finally, since the participants in our current study were US teenagers between the ages of 16 and 19, further research is necessary to establish whether the findings can be generalized to other populations. Overall, owing to these restrictions, more verification of our findings in subsequent research is required.
In conclusion, the findings of this study underscore the importance of focusing on vitamin D levels in adolescents, especially against the backdrop of modern societal lifestyles and dietary habits significantly impacting youth health. Our research not only reveals the prevalence of vitamin D deficiency in specific subgroups but also highlights the potential role of vitamin D levels in preventing cardiovascular diseases. Therefore, it is crucial for public health policymakers and healthcare professionals to regularly monitor the vitamin D levels of adolescents and implement appropriate interventions to maintain them within a healthy range. This may involve strategies such as dietary supplementation, encouraging outdoor activities for sun exposure, and promoting healthy lifestyle behaviors to mitigate the risk of vitamin D deficiency-related health complications.