Gastroesophageal reflux disease (GERD), characterized primarily by regurgitation and recurrent heartburn, is predominantly caused by esophageal disorders such as peptic strictures, reflux esophagitis, and Barrett’s esophagus [1]. In recent years, changes in living standards, lifestyle, and dietary habits have contributed to the increased prevalence of GERD. This condition not only diminishes quality of life for sufferers but also significantly increases healthcare resource utilization and economic burden [2]. Therefore, it is crucial to implement preventative measures to reduce the risk of GERD development.
Metabolic syndrome (MetS) encompasses a range of metabolic abnormalities, including hypertension, hyperglycemia, hypoalphalipoproteinemia, hypertriglyceridemia, and abdominal obesity [3, 4]. The incidence of MetS is rising globally [5]. Although several observational studies have identified positive correlations between GERD risk and MetS incidence [6, 7], these associations may be influenced by factors such as short follow-up periods, limited sample sizes, confounders, and reverse causation [8]. Thus, further analysis is necessary to determine the causal relationship between MetS and the risk of GERD development.
In this study, we conducted univariable Mendelian randomization (UVMR) and multivariable Mendelian randomization (MVMR) analyses to investigate the causal relationship between MetS, its components, and the risk of GERD development. Additionally, sensitivity analyses were performed to assess the impact of assumptions and the robustness of the results.
Methods
Study design
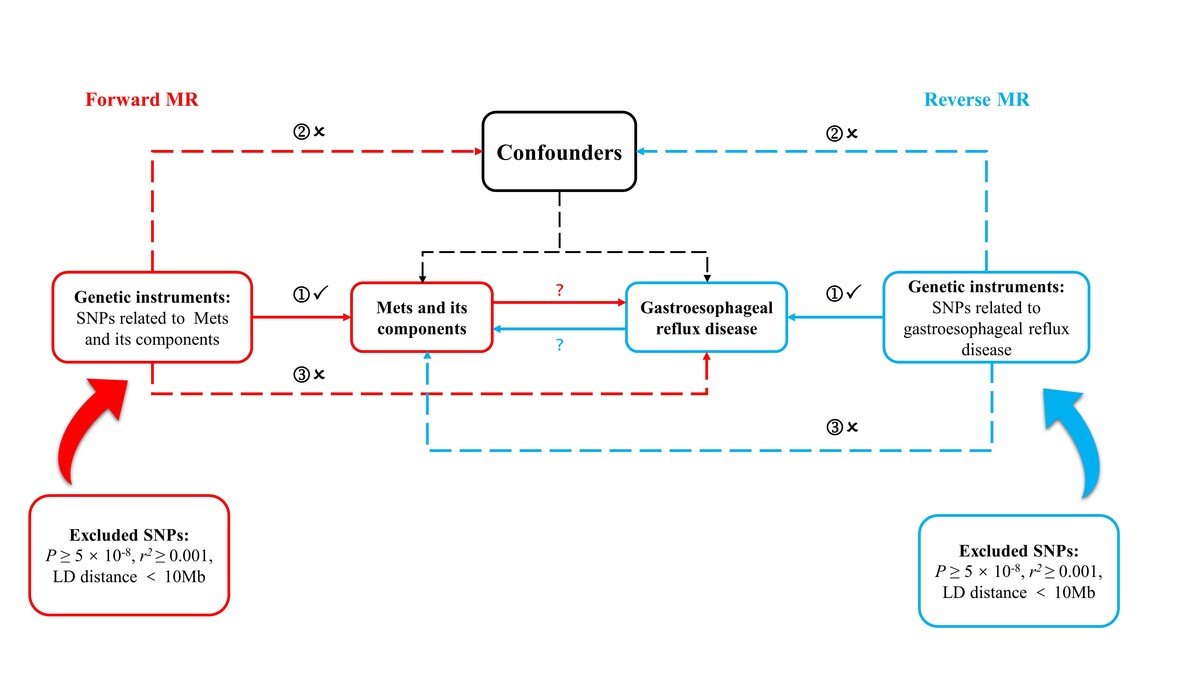
This research utilized a bidirectional two-sample Mendelian randomization (MR) analysis to investigate the causal relationship between MetS and its components with GERD risk [9]. By employing single nucleotide polymorphisms (SNPs) as instrumental variables, MR can reveal causality between specific exposures and outcomes [8]. This approach leverages the principle that genetic variant allocation follows Mendel’s second law, ensuring randomization and making MR comparable to a randomized controlled trial. This design is crucial for minimizing confounders and reverse causality inherent in observational studies, thereby enhancing the reliability of the results [10].
Data sources
Exposure
Data for MetS and its components were obtained from summary statistics of comprehensive genome-wide association studies (GWAS) conducted on MetS (n = 291,107), triglycerides (TG) (n = 441,016), and high-density lipoprotein (HDL) (n = 403,943) from the UK Biobank [11, 12]; body mass index (BMI) (n = 461,460), hypertension (n = 463,010), waist circumference (WC) (n = 462,166), and type 2 diabetes (T2D) (n = 461,578) from the Medical Research Council Integrative Epidemiology Unit (MRC-IEU); fasting blood glucose (FBG) (n = 58,074) from the Glucose and Insulin-Related Traits Consortium (MAGIC) [13]; and diastolic blood pressure (DBP) (n = 757,601) and systolic blood pressure (SBP) (n = 757,601) from the International Consortium of Blood Pressure [14].
Outcome
GERD data were obtained from a GWAS conducted by the MRC-IEU, involving 473,524 healthy controls and 129,080 GERD patients [15].
MR analyses
A genome-wide significance threshold of p < 5 × 10⁻⁸ was applied for selecting instrumental variables (IVs). SNPs exhibiting linkage disequilibrium (LD) (r2 < 0.001) within a 10 million base-pair region were excluded, retaining only independent SNPs [16]. In cases where the GWAS data lacked corresponding outcome SNPs, proxy SNPs in LD (r2 > 0.8) were used. We manually reviewed the harmonized data and excluded SNPs strongly associated with the outcome (p < 1 × 10⁻⁵). After excluding SNPs with strong outcome associations, bidirectional MR analysis was conducted. IVs with an F-statistic > 10 were considered robust [17]. The F-statistic was calculated using the formula: F = [(N – k – 1)/k] × [R2/(1 – R2)], where N represents the sample size, k the total number of SNPs, and R2 the proportion of variance explained by the IVs. PhenoScanner V2 was employed to identify other genome-wide significant traits associated with the SNPs that could serve as confounding factors [18].
The inverse variance weighted (IVW) method was the primary analysis tool for estimating causal effects [19]. Sensitivity analyses included MR-Egger, weighted median, and weighted mode approaches [20]. Heterogeneity was assessed using Cochran’s Q statistic (p < 0.05). Potential outliers were identified through leave-one-out analysis and forest plots, while horizontal pleiotropy was detected using the MR-Pleiotropy RESidual Sum and Outlier (MR-PRESSO) and MR-Egger intercept tests [21]. MR-PRESSO was also used to evaluate the influence of identified outliers on MR results, followed by MR analysis post-outlier removal [22].
Additionally, we employed multivariable Mendelian randomization (MVMR)-IVW method to validate significant causal relationships identified in the UVMR analysis, ensuring adjustments for potential confounding factors associated with MetS, BMI, WC, hypertension, HDL, TG, and T2D.
Results
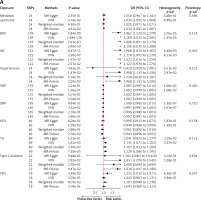
The SNPs related to MetS, its components, and GERD are detailed in Supplementary Tables SI and SII. Using the IVW method, we identified significant causal associations between GERD risk and several factors, including waist circumference, BMI, type 2 diabetes, hypertension, TG, MetS, and HDL cholesterol. The respective odds ratios (OR) were 2.166, 2.160, 1.951, 1.908, 1.135, 1.034, and 0.944, with corresponding 95% confidence intervals (CIs) of 1.972–2.270, 2.033–2.295, 1.074–3.545, 1.135–3.206, 1.071–1.203, 1.002–1.068, and 0.896–0.994, all with associated p-values < 0.001. However, no significant causal associations were found between GERD risk and FBG, SBP, or DBP, with respective ORs of 1.043, 1.002, and 0.997, corresponding 95% CIs of 0.963–1.131, 0.999–1.005, and 0.991–1.003, and p-values of 0.302, 0.196, and 0.332.
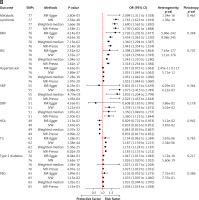
Significant heterogeneity was observed for all traits except MetS (p = 0.498), HDL (p = 0.158), T2D (p = 0.528), and FBG (p = 0.386), but no pleiotropy was detected. Additionally, the MR-PRESSO test did not identify any distorted effect outliers (Figure 1 A). Supplementary Figures S1–S10 display the significant causal effects between MetS, its components, and GERD risk using leave-one-out, forest, funnel, and scatter plots.
Figure 1
A – Mendelian randomization results of the effect of metabolic syndrome and its components and GERD. B – Mendelian randomization results of the effect of GERD and metabolic syndrome and its components
BMI – body mass index, WC – waist circumference, SBP – systolic blood pressure, DBP – diastolic blood pressure, HDL – high-density lipoprotein, TG – triglyceride, FBG – fasting blood glucose.


In the reverse analysis, the IVW method revealed significant causal relationships between GERD risk and MetS, BMI, WC, DBP, SBP, hypertension, HDL, TG, T2D, and FBG. The respective ORs were 1.765, 1.454, 1.324, 1.378, 1.973, 1.053, 0.433, 1.187, 1.026, and 1.033, with corresponding 95% CIs of 1.623–1.919, 1.363–1.550, 1.258–1.393, 1.135–1.672, 1.415–2.749, 1.045–1.062, 0.816–0.851, 1.159–1.215, 1.020–1.032, and 1.007–1.060, all with p-values < 0.001. Significant heterogeneity was observed for all traits except FBG (p = 0.737), with no significant horizontal pleiotropy (p > 0.05), as indicated by the MR-Egger intercept test (Figure 1 B). Supplementary Figures S11–S20 display the significant causal effects between GERD and MetS and its components using leave-one-out, forest, funnel, and scatter plots.
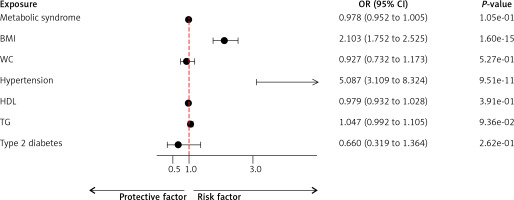
MVMR analysis revealed that among the MetS components, BMI (OR = 2.103; 95% CI: 1.752–2.525; p = 1.60E–15) and hypertension (OR = 5.087; 95% CI: 3.109–8.324; p = 9.51E–11) were positively associated with the risk of GERD development (Figure 2).
Discussion
The this study, we evaluated the effects of MetS and its components on the risk of GERD development using MR analysis. The UVMR analysis demonstrated that MetS, WC, BMI, hypertension, HDL, TG, and T2D were associated with GERD risk, whereas DBP, SBP, and FBG did not show a causal relationship with GERD. Interestingly, reverse MR analysis revealed causal associations between GERD and both DBP and SBP. Furthermore, MVMR analysis identified BMI and hypertension as having a causal relationship with GERD. Sensitivity analysis confirmed the absence of horizontal pleiotropy, reinforcing the robustness of our findings.
Adipose tissue in individuals with obesity is metabolically active, producing various inflammatory cytokines that contribute to systemic chronic inflammation, which can promote the development of GERD [23]. The link between obesity and GERD has been well established in numerous epidemiological studies [24]. Obesity contributes to insulin resistance, leading to a cascade of metabolic abnormalities that are key determinants of MetS [25]. This complexity makes it challenging to discern whether obesity alone is causally involved in GERD or if obesity, along with its associated metabolic disorders, collectively contributes to GERD development. Epidemiological evidence suggests that MetS is significantly associated with an increased risk of GERD [26]. For example, a cross-sectional study (n = 372) found that patients with MetS had a higher incidence of reflux esophagitis (RE) [27]. Additionally, a meta-analysis of 15 cohorts (n = 103,048) indicated that MetS may independently serve as a risk factor for GERD [28]. Consistent with these findings, our bidirectional MR analysis revealed a highly significant bidirectional causal association between MetS and GERD risk.
However, our study has certain limitations. First, our research was conducted within a European population, which may limit the generalizability of our findings to other ethnic groups. Second, we were unable to perform stratified analyses based on gender and age due to the lack of individual-level data, underscoring the need for further comprehensive prospective studies. Lastly, while MR analysis provides valuable insights into causal relationships, it does not elucidate the underlying biological mechanisms.
In conclusion, our UVMR and MVMR analyses identified causal associations between MetS, its components, and GERD development risk. However, further studies are needed to validate the role of MetS and its components in regulating GERD development. Our findings suggest that MetS may serve as an early intervention target for preventing GERD.


