Introduction
Heart failure is a prevalent and life-threatening cardiovascular complication of type 2 diabetes with an increasing global burden in the past decades [1, 2]. Compared to patients with heart failure but without type 2 diabetes, those with heart failure and type 2 diabetes face a higher incidence of adverse events [3]. Precision estimation of the in-hospital prognosis is valuable for clinical decision-making as it aids in balancing the benefits and harms at the individual level [4, 5]. While many parameters serve as prognostic factors, few reflect hepatic function, which may be the consequence of circulatory failure. Reduced cardiac output leads to liver congestion, hepatic dysfunction, increased liver stiffness and even cirrhosis in the long term by obstructing hepatic venous outflow obstruction and hypoperfusion [6, 7]. Although previous studies linked liver dysfunction such as elevated alanine aminotransferase (ALT) or aspartate aminotransferase (AST) values with the prognosis in hospitalized and non-hospitalized heart failure patients, the results remain inconclusive across studies with heterogeneous populations [8–12]. It is imperative to explore new surrogate markers that can accurately reflect liver function and predict the prognosis of patients with type 2 diabetes and heart failure.
The AST/ALT ratio, also known as the De Ritis ratio, is a simple and readily accessible biomarker that was initially proposed by De Ritis in 1957 as a tool to improve the diagnosis of acute viral hepatitis [13]. The AST/ALT ratio has been validated and widely used as a noninvasive marker to assess the presence of liver dysfunction as well as the severity of liver stiffness in several hepatic diseases, including non-alcoholic fatty liver disease, alcoholic hepatitis and chronic viral hepatitis [14]. Several studies have suggested the AST/ALT ratio as a potential prognostic factor for metabolic diseases and cardiovascular diseases, such as type 2 diabetes, acute myocardial infarction (AMI), and acute and chronic heart failure [15–20]. However, evidence is scarce as to whether the AST/ALT ratio reflects the prognosis in hospitalized patients with type 2 diabetes and heart failure.
Based on a large electronic medical record (EMR)-derived cohort of diabetic patients in China, this study investigated the association between AST/ALT ratio and fatal, cardiac, infectious and kidney outcomes in patients with type 2 diabetes and heart failure, aiming to better evaluate the prognosis by this parameter.
Material and methods
Data source
This retrospective study compiled data on diabetic patients hospitalized due to heart failure, drawing from the West China Electronic Medical Record Collaboration Of DiabetEs (WECODe). WECODe is a multicenter database established to store EMRs of individuals with diabetes in Sichuan Province, China. Since January 2011, WECODe has systematically collected longitudinal EMR information from patients with diabetes in both inpatient and outpatient settings, spanning multiple tertiary hospitals in Sichuan Province, China [21]. Further details on this database can be found in a prior publication [21]. To summarize, WECODe recruited Chinese adult diabetic patients from inpatient and outpatient care and collected de-identified data from eight sources of EMRs. These sources included records related to demographics, vital signs, laboratory results, glucose monitoring, diagnoses, prescriptions, surgical procedures, as well as medical and discharge summaries. To identify post-discharge mortality, the database was cross-referenced with the death registry at the Sichuan Center for Disease Control and Prevention (CDC) during the period from January 1, 2011, to March 2, 2023. The Big Data Platform at West China Hospital of Sichuan University (WCH-BDP) played a pivotal role in both data storage and analysis [22].
Study population
We identified patients with diabetes from EMR in the inpatient and outpatient settings, respectively (details in previous publications) [23, 24]. This study included patients: 1) with type 2 diabetes; 2) with heart failure and New York Heart Association (NYHA) class II or more advanced classes (III or IV) in the ICD code or the free text in the admission diagnosis records (Supplementary Table SIII); 3) with a hospital stay over 2 days; 4) who were discharged between January 1, 2011, and June 30, 2019, or with census registered in Sichuan Province; 5) with available records of diagnosis at discharge. We excluded individuals: 1) with unavailability of essential parameters on admission (systolic blood pressure, AST, ALT, serum creatinine, blood glucose, glycated hemoglobin A1c [HbA1c], hemoglobin, low-density lipoprotein [LDL-C] and N-terminal pro-B-type natriuretic peptide [NT-proBNP]); 2) who were admitted to, transferred to, or discharged from the surgical departments; 3) with outliers of AST/ALT ratio (< 1% percentile or > 99% percentile). If a patient had two or more hospitalizations, this analysis adopted the latest hospitalization record.
Data collection and baseline characteristics
The index date was the calendar date on admission. The baseline period spanned a 30-day window before the index date and ended 1 day after admission. We identified the baseline heart rate, blood pressure, and prescriptions as the initial records on or close to the index date. The baseline value for a specific parameter, such as laboratory records including the AST and ALT values, was determined by selecting the record closest to the index date during the baseline period. We linked the inpatient and outpatient data in WECODe during the observation period. Details of data collection and comprehensive descriptions and definitions for each parameter can be found in Supplementary Appendix A and Supplementary Tables SI–SIII as well as in a previous paper [21].
The estimated glomerular filtration rate (eGFR) was calculated using the chronic kidney disease epidemiology collaboration (CKD-EPI) formula [25]. An eGFR below 60 ml/min/1.73 m² indicates impaired kidney function. Furthermore, the Charlson Comorbidity Index (CCI) was utilized to evaluate the burden of comorbidities among the patients [26]. This assessment relied on the International Classification of Diseases 10th Revision (ICD-10) codes found in the discharge diagnosis records.
Exposure
The AST/ALT ratio was calculated as the AST value (U/l) divided by the ALT value (U/l) [19]. AST and ALT values on admission were used as the first measurement on or close to the index date. For analyses, the AST/ALT ratio was handled either as a continuous variable or as a categorized variable by quartiles (using the first quartile as the reference group).
Follow-up and outcomes
To assess outcomes during hospitalization, we followed the patients from the index date to the first occurrence of a given adverse event or discharge, whichever came first. We merged the in-hospital death and CDC death registry records to identify all-cause deaths occurring within 30 and 90 days after discharge.
The primary outcomes consisted of death within 30 days after discharge as well as three in-hospital endpoints, including composite cardiac events, major acute kidney injury (AKI), and major systemic infection within the in-hospital follow-up period. Composite cardiac events included a new episode of acute heart failure after admission, cardiogenic shock, requiring cardiopulmonary resuscitation and death during hospitalization. Major AKI was determined as reaching AKI stage 2 or 3 [21, 27]. Major systemic infection was identified by starting restricted antibiotic therapy on the third calendar day after admission or later. Patients were viewed as having initiated medication during hospitalization if the medication had not been administered prior to or on admission, but was commenced on the subsequent day or thereafter. The secondary endpoints were death within 90 days after discharge, each component of composite cardiac events, AKI at any stage, and initiating any antibiotics during hospitalization. Detailed definitions of these endpoints were previously published [21].
Medication usages were identified and categorized from the prescription records by following the Anatomical Therapeutic Chemical (ATC) Classification System [28], which was further elaborated in Supplementary Table SI.
Statistical analysis
All statistical analyses were conducted using RStudio 2022.7.1.554 (version 4.2.1). A two-sided p-value less than 0.05 was considered statistically significant.
Imputation of missing data
The missing variables were imputed using the chained random forest algorithm. In this method, missing values for each variable were predicted by employing a random forest comprising 500 trees, with all other variables included as covariates in the prediction process. This imputation procedure was repeated in ten iterations.
Baseline characteristics
If continuous variables were normally distributed as examined by the Kolmogorov–Smirnov test (p ≥ 0.001), the study reported their values as means ± standard deviations (SDs). For variables that deviated from a normal distribution, they were presented as the median along with the interquartile range (IQR). Categorical variables were described as frequencies and percentages. We performed Spearman’s correlation analysis to assess the association between the AST/ALT ratio on admission and other baseline characteristics.
Entropy balancing weights
We established entropy balancing weights through a process of weight optimization [29]. These weights aimed to balance the moments of various covariates, including age, sex, body mass index (BMI), baseline systolic blood pressure, baseline eGFR, baseline NT-proBNP, admission department, CCI, presence of AMI, use of insulin at baseline, and use of venous loop diuretics at baseline.
Linear association and risks of outcomes across AST/ALT ratio quartiles
This study investigated both the continuous values and the quartiles of the AST/ALT ratio. Supplementary Figure S1 provided a visual representation of the correlation between the AST/ALT ratio and each covariate before and after applying entropy balancing. Supplementary Figure S2 displayed the absolute standardized mean differences (SMD) across quartiles before and after the implementation of entropy balancing.
We subsequently employed Cox proportional hazards regression models with entropy balancing weights to calculate hazard ratios (HRs) and their corresponding 95% confidence intervals (CIs). These calculations were performed for two scenarios: per SD increment of the AST/ALT ratio (as a continuous variable) and different quartiles of the AST/ALT ratio, with the lowest quartile of the AST/ALT ratio used as the reference group, for each outcome of interest. To account for potentially correlated observations arising from variations in-hospital demographics, we utilized the shared frailty model, which constructs cluster-specific hazard functions before generating a joint hazard function [30].
Subgroup analyses and sensitivity analyses
Participants were divided into subgroups by their NYHA classes (II or III vs. IV), baseline HbA1c level (< 7.0% vs. ≥ 7.0%), and the presence or absence of AMI on admission for subgroup analyses. To assess the robustness of our findings, we conducted two sensitivity analyses: 1) by excluding patients who experienced a given outcome within two calendar days after admission, and 2) by excluding patients with a known history of viral hepatitis, drug-induced liver injury, alcohol-induced liver disease, liver cirrhosis, Wilson’s disease, hemochromatosis and other chronic liver diseases.
Results
Baseline characteristics
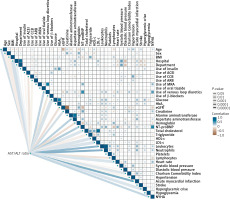
This study enrolled 8,073 non-surgical patients with type 2 diabetes hospitalized with heart failure; the process of patient selection was summarized in Supplementary Figure S3. As shown in Table I, the median age of the study population was 71 years (IQR: 63 to 77 years), and 3,177 (39.4%) were females. Patients had a median AST/ALT ratio of 1.11 (IQR: 0.83 to 1.50) and a median length of hospital stay of 8 days (IQR: 4 to 12 days) (Supplementary Figure S4). Across the four quartiles of AST/ALT ratio, patients falling in the highest quartile (fourth quartile) were the oldest, with the highest levels of NT-proBNP, leukocytes, total cholesterol (TC) and LDL-C, and the lowest level of hemoglobin. The proportions of patients who were users of angiotensin-converting enzyme inhibitors (ACEI), calcium channel blockers (CCB), angiotensin II receptor blockers (ARBs) or β-blockers were all lowest in the highest quartile of the AST/ALT ratio. In the fourth quartile, the highest percentages of patients presented with NYHA class III or IV, had impaired kidney function, and received treatment with insulin, mineralocorticoid receptor antagonists (MRAs) or venous loop diuretics at baseline. Figure 1 showed the correlation map of baseline characteristics before applying entropy balancing.
Table I
Baseline characteristics stratified by AST/ALT ratio quartiles
[i] Data are presented as median (interquartile range, IQR) for continuous variables, and count (percentage) for categorical variables. ACEI – angiotensin-converting enzyme inhibitor, ALT – alanine aminotransferase, AMI – acute myocardial infarction, ARBs – angiotensin II receptor blockers, AST – aspartate aminotransferase, BMI – body mass index, CCB – calcium channel blocker, eGFR – estimated glomerular filtration rate, GDMT – guideline-directed medical therapy, HbA1c – glycated hemoglobin A1c, HDL-C – high-density lipoprotein cholesterol, IHD – ischemic heart disease, LDL-C – low-density lipoprotein cholesterol, MRAs – mineralocorticoid receptor antagonists, NT-proBNP – N-terminal pro-B-type natriuretic peptide, NYHA – New York Heart Association, TC – total cholesterol, TG – triglycerides.
Figure 1
Correlation heatmap of baseline characteristics. The color represents the Spearman correlation coefficient (rs, which always falls between –1 and 1). Brown and blue indicate a negative and positive correlation, respectively. The closer rs is to zero, the weaker the correlation between the two variables is, and the lighter the color is. The width of the line and size of the square indicate the significance level in statistics, constructed based on the transformation of Spearman’s P, –log10 (Spearman’s P), with the cutoff points, –log10 (0.00001), –log10 (0.0001), –log10 (0.001), –log10 (0.01), –log10 (0.05). The larger the size of the square is (the wider the line is), the smaller Spearman’s P is
ACEI – angiotensin-converting enzyme inhibitor, ARB – angiotensin II receptor blockers, CCB – calcium channel blocker, eGFR – estimated glomerular filtration rate, HbA1c – glycated hemoglobin A1c, HDL-C – high-density lipoprotein cholesterol, IHD – ischemic heart disease, LDL-C – low-density lipoprotein cholesterol, MRA – mineralocorticoid receptor antagonists, NT-proBNP – N-terminal pro-B-type natriuretic peptide, NYHA – New York Heart Association.

Adverse events in patients with different AST/ALT ratio values
Primary outcomes
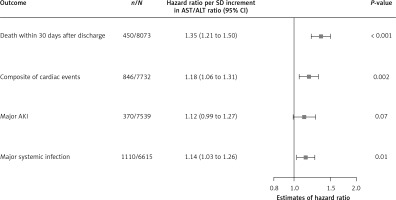
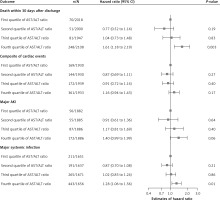
Among 8,073 patients, 450 died during hospitalization or within 30 days after discharge. As shown in Figure 2, for each SD increment of the AST/ALT ratio, patients had a 35% increased risk of death within 30 days after discharge (HR = 1.35; 95% CI: 1.21 to 1.50). Compared to patients with an AST/ALT ratio in the first quartile, those within the fourth quartile faced a 61% higher risk of death within 30 days after discharge (HR = 1.61; 95% CI: 1.18 to 2.19) (Figure 3).
Figure 2
Adjusted hazard ratios of AST/ALT ratio with primary outcomes in the total study population
AKI – acute kidney injury, ALT – alanine aminotransferase, AST – aspartate aminotransferase, CI – confidence interval, SD – standard deviation.

Figure 3
Adjusted hazard ratios of AST/ALT ratio quartiles for primary outcomes in the total study population

Among 7,732 patients, 846 patients met the composite cardiac events of a new episode of acute heart failure after admission, cardiogenic shock, requiring cardiopulmonary resuscitation and death during hospitalization. Patients with a per-SD higher AST/ALT ratio were at an 18% increased risk of composite cardiac events (HR = 1.18; 95% CI: 1.06 to 1.31) (Figure 2). Compared to patients with an AST/ALT ratio in the first quartile, those falling into the fourth quartile faced a higher risk of composite cardiac events, though without significance (HR = 1.16; 95% CI: 0.94 to 1.43) (Figure 3).
370 of 7,539 patients experienced major AKI. With each SD increase in the AST/ALT ratio, the adjusted HR (95% CI) for major AKI was 1.12 (0.99 to 1.27) (Figure 2). In comparison to patients in the first quartile of the AST/ALT ratio, those in the fourth quartile exhibited a higher risk of major AKI, although this difference did not reach statistical significance (HR = 1.40; 95% CI: 0.99 to 1.99) (Figure 3).
Major systemic infection occurred in 1,110 of 6,615 patients. As shown in Figure 2, patients with each SD increment of AST/ALT ratio faced a 14% elevated risk of major systemic infection (HR = 1.14; 95% CI: 1.03 to 1.26). Compared to patients with the AST/ALT ratio in the first quartile, those in the fourth quartile were at a 28% higher risk of developing major systemic infection (HR = 1.28; 95% CI: 1.06 to 1.56) (Figure 3).
Secondary outcomes
As shown in Supplementary Figure S6, with every SD increment of the AST/ALT ratio, patients had a more than 30% higher risk of death within 90 days after discharge (HR = 1.31; 95% CI: 1.18 to 1.45) or death during hospitalization (HR = 1.38; 95% CI: 1.22 to 1.56), and an 8% higher risk of AKI at any stage during hospitalization (HR = 1.08; 95% CI; 1.00 to 1.17). The associations between each component of secondary outcomes and different AST/ALT quartiles were presented in Supplementary Figure S7. Our findings were consistent among the subgroup and sensitivity analyses (Supplementary Figures S5, S8–S11).
Discussion
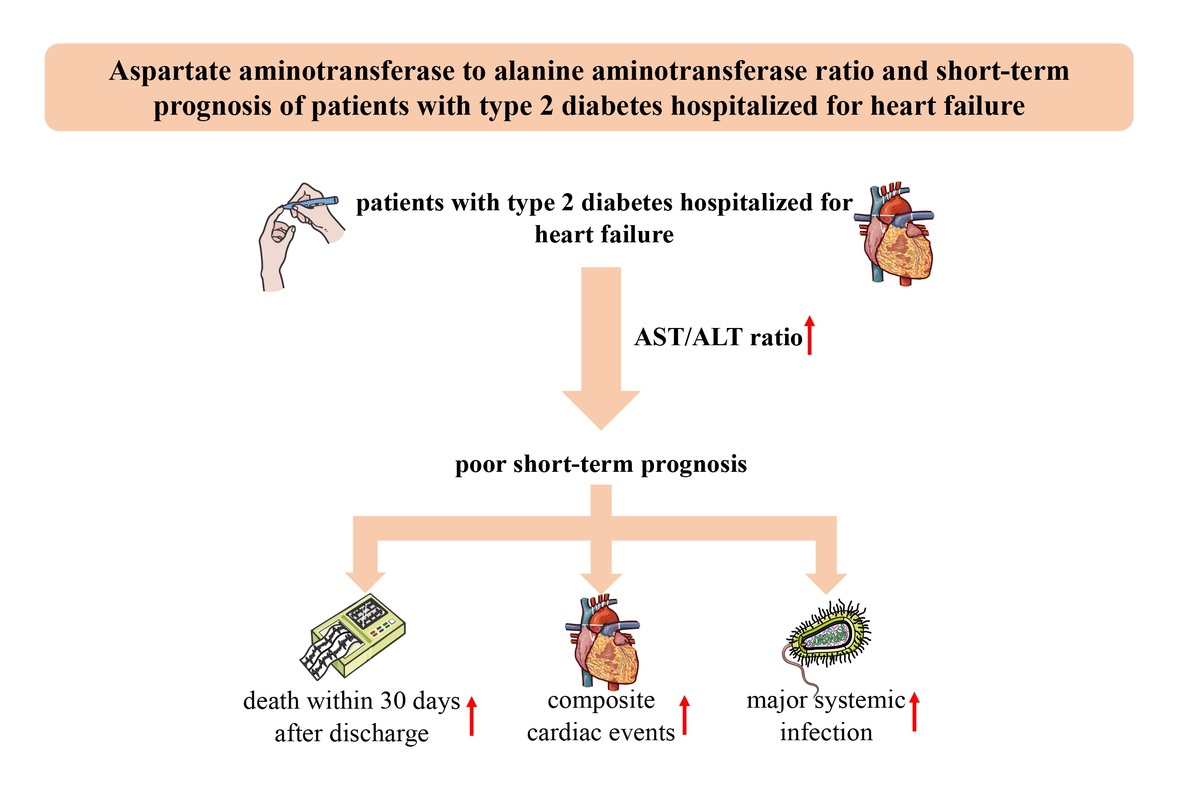
The current study showed that among non-surgical patients with type 2 diabetes hospitalized for heart failure, those in the highest quartile for the AST/ALT ratio faced a 60% increased risk of death within 30 days after discharge and a nearly 30% increased risk of major systemic infection during hospitalization. The findings were consistent across subpopulations and confirmed by multiple sensitivity analyses. This is the first study revealing the prognostic value of the AST/ALT ratio in patients with type 2 diabetes and heart failure.
In line with previous studies in patients with heart failure but without type 2 diabetes [17, 19, 20], we corroborated a clear association between elevated AST/ALT ratio and increased risks of all-cause mortality and adverse cardiac events, especially in those with type 2 diabetes. In older patients (aged ≥ 65 years) with heart failure, high AST/ALT (≥ 1.70) was independently associated with greater 1-year mortality as well as heart failure rehospitalization [17, 19]. Another study including 3,212 patients with heart failure with preserved ejection fraction (HFpEF) reported that patients in the high AST/ALT ratio group (> 1.0) were at a 30% increased risk of the primary composite outcome, including cardiovascular death, aborted cardiac arrest, or hospitalization for management of heart failure, after a median follow-up of 3.3 years [20].
Adding to established prognostic markers for heart failure, such as NT-proBNP and ejection fraction (EF), the AST/ALT ratio provides new prognostic information. Clinicians may easily identify patients with a poorer prognosis using this parameter readily available from a hepatic function report. For individuals with markedly elevated AST/ALT (falling in the highest quartile of the population, meaning > 1.5 in this study), the risk of death increased 1.6-fold. Such a condition warrants additional attention and more intensive care to prevent adverse events in advance, which reflects individualized healthcare. Clinicians should consider additional therapy in such patients, even if the therapies are not common in those at lower risk. The balance of benefits and harms could be challenging in decision making, especially when the effect size and/or the certainty of evidence is low. An individualized treatment response, as well as the values and preferences of patients, is also critical in choosing the therapies [31].
In the current study, people with the highest AST/ALT ratio represented those with the highest baseline risk, including impaired kidney function and comorbidity. Nevertheless, AST/ALT shows additional prognostic values after adjusting for potential biases. It indicates that the AST/ALT ratio captures additional information on baseline risks that previous parameters were unable to. A previous study reported that an elevated AST/ALT ratio was associated with cardiac arrest and multiple end-organ damage [32], which were difficult to detect using other traditional parameters such as EF and NT-proBNP.
Several physiological mechanisms have been postulated to explain the association between the AST/ALT ratio and an unfavorable prognosis in heart failure patients. ALT is predominantly localized in the cytoplasm of hepatocytes, making it a more specific marker of hepatocellular injury [33]. Apart from the liver, AST could be found in other tissues, such as the heart, skeletal muscle, kidney and brain, and it exists in both the cytoplasm and mitochondria [14]. Due to its high activity in the myocardium, AST was the first biomarker of myocardial necrosis and was initially used for diagnosing myocardial infarction [34]. When myocardial necrosis occurred, AST usually rose significantly while ALT could remain normal, resulting in an elevated AST/ALT ratio; thus, a higher AST/ALT ratio might reflect the severity of myocardial necrosis, a well-accepted prognostic factor of heart failure [35]. Although we cannot entirely rule out the possibility that the interaction between myocardial injury and the AST/ALT ratio may impact the prognosis of the study population, even after adjusting for AMI, our results were in line with previous studies showing that AMI is a prognostic factor for patients with heart failure by any etiology.
In line with previous studies, patients with a higher AST/ALT ratio were older in the current study. Serum ALT levels decrease with age, and low ALT might reflect hepatic aging [36–38], which could significantly promote the generation of reactive oxygen species (ROS), leading to oxidative stress [39]. Oxidative stress impairs mitochondria, and subsequently elevates serum AST significantly, outweighing the mildly increased serum ALT. Through metabolic compensation, people in the highest quartile of the AST/ALT ratio, indicative of the most severe mitochondrial lesions, demonstrated the worst prognosis compared to those with mild elevations [15].
Liver congestion is common in patients with worsening heart failure due to impaired venous drainage and systemic congestion [6, 40]. It leads to perisinusoidal edema and hepatic ischemia [40]. Since AST is distributed mainly in the centrilobular region and is vulnerable to ischemic injury, the level of AST rises more than that of ALT during liver congestion, resulting in an increased AST/ALT ratio [41, 42]. Consistent with a previous study, we confirmed the association between a higher AST/ALT ratio and indicators of systemic congestion, including increased NT-proBNP level and higher venous loop diuretics usage [19]. Hence, it is further proposed that a higher AST/ALT ratio may serve as an indicator of systemic congestion in heart failure patients, suggesting a higher likelihood of poor outcomes [19].
However, the current study has some limitations that need to be mentioned. Firstly, the analyses only employed the baseline AST/ALT ratio. The effect of fluctuations in AST and/or ALT values during hospitalization or after discharge on the overall prognosis of heart failure remains unclear and warrants further elucidation. Secondly, the retrospective design entails the risk of selection and information bias and residual confounders, although entropy balancing weights were implemented to adjust for potential confounders. The E values, which estimated the potential impact of unmeasured confounders, suggested the robustness of our main findings. Thirdly, the retrospective design is unable to support a causal conclusion. This study thus suggested AST/ALT ratio as a risk factor rather than a cause of adverse events in patients with type 2 diabetes and heart failure. Fourthly, the current study only explored short-term outcomes, and subsequent studies could investigate the prognostic value of the AST/ALT ratio for long-term outcomes. Finally, the current study included only Chinese patients; therefore future studies should be conducted in people from other ethnicities.
In conclusion, higher AST/ALT ratio predicts a poorer short-term prognosis in non-surgical patients with type 2 diabetes and heart failure, especially those in the highest quartile. The AST/ALT ratio at admission could be a useful predictor and a tool for risk stratification in patients with heart failure and type 2 diabetes. Our findings warrant additional validation for the pragmatic application of the AST/ALT ratio in a larger population and other ethnicities.


