Introduction
Non-alcoholic fatty liver disease (NAFLD) is a metabolic syndrome commonly seen in clinical practice. As living standards in China continue to improve, the dietary structures and lifestyles of the country’s citizens has become increasingly westernised and the incidence rate of NAFLD has grown. Non-alcoholic steatohepatitis (NASH), one of the two subtypes of NAFLD, may eventually progress to liver cirrhosis and cancer [1]. Unfortunately, because the number of NAFLD cases in China has gradually increased, the number of cases of liver cirrhosis has also risen. Therefore, exploration of the pathological mechanism of NASH and development of approaches to prevent its occurrence are important research hotspots. The most commonly recognised theories of the pathogenesis of NAFLD include the “two-hit” mechanism. In this mechanism, the first hit induces fat accumulation. Then, under the effects of cytokines produced during stress, pathogenic factors, and activation of hepatic stellate cells, the second hit occurs, leading to inflammation, apoptosis, and fibrosis of the liver [2–4]. This mechanism indicates that regulating the inflammatory reaction may significantly reduce, delay, or even reverse the incidence of fatty liver. Thus, regulation of the inflammatory reaction is an important target in NASH drug research.
Aloperin (Alo), an alkaloid extracted from the TCM Sophora alopecuroides, has anti-inflammation, anti-tumour, and anti-infection effects [5]. Research shows that Alo could efficiently inhibit the apoptosis caused by various forms of inflammation [6–9]. In the present research, the hepato-protective activity of Alo towards NASH and its possible mechanism were explored by assessing the influence of the alkaloid on the expression of Toll-like receptor (TLR) 4 and relevant proteins in NASH cells and liver of rats.
Material and methods
Fifty clean, healthy, adult male Sprague–Dawley rats weighing 180–220 g were provided by the Laboratory Animal Centre in Kunming Medical University (License No. SYXK (dian)2011-0004) and fed adaptively for 2 weeks in the laboratory. Rats in the normal group were fed normal fodder for 16 weeks. Rats in the model and Alo groups were continuously fed a high-fat + high-sugar diet (8% normal fodder, 2% cholesterol, and 10% lard oil) for 16 weeks. After feeding for 12 weeks, 5, 25, and 50 mg/kg·d Alo (Ningxia Yanchi Pharmaceutical Factory) was administered to rats in the Alo-L, Alo-M, and Alo-H groups, respectively, by gavage for 8 weeks. After feeding for 16 weeks, the rats were anaesthetised intraperitoneally and sacrificed using 2% Nembutal. Blood samples were collected, and the liver was rapidly excised. Liver samples were obtained from the same portion of the bulk organ from each rat and fixed with 4% paraformaldehyde. The remaining livers were stored in a refrigerator at –80°C.
Preparation and observation of hepatic tissue specimens
Hepatic tissues were fixed with 4% paraformaldehyde and prepared for paraffin sectioning. The sections were stained with haematoxylin–eosin, and changes in the morphology of hepatic tissues were observed under an optical microscope at 200× magnification.
TUNEL testing
After paraffin embedding, tissue slices (thickness, 5 µm) were dewaxed in xylene and hydrated using an ethanol gradient. A dUTP terminal transferase kit was used to examine cell apoptosis in liver tissues and counted through a high-power field of 400×. Photographs of the tissue slices were obtained by a microscope.
Immunohistochemistry assay
Hepatic tissue specimens were embedded in paraffin to prepare slices and perform tissue antigen repair with dewaxing. The slices were rinsed first with distilled water and then with PBS three times. Next, the slices were incubated at room temperature with hydrogen peroxide for 5–10 min to eliminate the activity of endogenous peroxidase. The slices were rinsed once more with distilled water, immersed in PBS, and sealed with normal goat serum at a volume fraction of 5–6%. The specimens were incubated at room temperature for 30 min, applied with a working solution of primary antibodies (TLR4 1 : 1000; TRIF 1 : 1000; NF-κB 1 : 1000), and then incubated for 1–2 h at 37°C or in a refrigerator at 4°C overnight. After incubation, the specimens were rinsed thrice with PBS for 3 min each time, dripped with the appropriate anti-working solution marked with biotin, and incubated at 37°C for 15 min. Thereafter, the specimens were rinsed thrice with PBS for 3 min each time, stained with DAB, rinsed thoroughly with tap water, re-dyed, dehydrated, transparentised, and sealed. The results were observed under an optical microscope at 200× magnification.
RT-qPCR
Rat liver tissues and total DNA in cells were extracted according to the instructions of an RNA extraction kit and reverse-transcribed according to a reverse transcription kit. The reaction conditions were as follows: 37°C (15 min × 1 cycle) and 85°C (5 s × 1 cycle). The RT products were stored at 4°C. Then, 2 µl of the RT products was blended with the reagents of a real-time PCR kit (total volume, 20 µl) for PCR amplification under the following reaction conditions: 95°C (30 s, 1 cycle) and (95°C × 5 s, 60°C × 34 s) for a total of 40 cycles. The relative contents of the target genes were calculated using the 2–ΔΔCT method. The primer sequences used were as follows: TLR4: F: 5’-CTGCATAGAGGTAGTTCCT-3’; R: 5’-TCCAGCCACTGAAGTTCTGA-3’; TRIF: F: 5’-AGATCAGCCAGTCGCCCACTCT-3’; R: 5’-GTCAGGTTCTTCGCAGCCTTCAG-5’; NF-κB): F: 5-ACGATCTGTTTCCCCTCATC-3’; R: 5’-TGCTTCTCTCCCCAGGAATA-3’; β-actin: F: 5’-AGTCTGTGTGGA-TTGGTGGC-3’; R: 5’-AGAAAGGGTGTAAAACGGAGC-3’.
Cell culture
Cryopreserved L02 cells were rapidly thawed at 37°C, centrifuged at 1000 rpm for 5 min, and washed twice with DMEM culture solution. The cells were then resuspended in DMEM basal culture medium and centrifuged once more. Next, the cells were added with DMEM complete medium and cultured with 5% CO2 at 37°C.
Establishment of the NASH cell model
The cell concentration was adjusted to 1 × 10⁵/ml, and cells were inoculated into the wells of a 96-well culture plate (100 µl/well). The cells were incubated for 24 h in 5% CO2 until 80% adhesion was achieved. The cells were stimulated with 500 µmol/l FFA (determined by the results of trial tests) for 24 h to establish the NASH cell model.
Cell grouping
L02 cells were divided into the normal, model, and Alo-treatment groups (including low [Alo-L)-, moderate (Alo-M)-, and high (Alo-H)-dose groups). Cells in the model and Alo-treatment groups were used to construct a NASH cell model. L02 cells in the Alo-L, Alo-M, and Alo-H treatment groups were treated with 5, 25, and 50 ml/l Alo, respectively, for 72 h for follow-up experiments.
Examination of apoptosis by flow cytometry
L02 cells in each group were digested with pancreatin and then collected. The cells were rinsed twice with PBS and centrifuged at 1000 rpm and 4°C for 5 min. The cells were added with 500 µl of binding buffer for suspension and then treated with 5 µl of annexin V-FITC and 5 µl of propidium iodide. The reagents were allowed to react for 10 min at room temperature in the dark. Finally, the cells were examined using a flow cytometer. This experiment was repeated three times.
Assessment of NF-κB(p65) nuclear import by cell immunofluorescence
L02 cells in the logarithmic phase were obtained from each group, the serum was carefully eliminated with PBS, and the cells were rinsed. The cells were fixed with 70% methanol solution at 4°C for 30 min, incubated for 15 min with 0.5% Triton X-100 to remove the cytomembrane, and sealed with 5% goat serum for 1 h. Next, the cells were treated with the rabbit anti-human monoclonal antibody of NF-κB(p65) (dilution, 1 : 200) and incubated overnight at 4°C. The samples were rinsed thrice with PBST for 10 min each time, treated with FTTC-labelled fluorescence secondary antibodies (dilution, 1 : 200), and rinsed thrice with PBST for 10 min each time. The cell nucleus was dyed with 10 µg/ml DAPI, and the resulting fluorescence intensity was examined by using Image-Pro Plus6.0 software.
Western blot
The cells were placed in an ice bath, cracked in RIPA lysate for 30 min, centrifuged at 15,000 rpm for 20 min at 4°C, and then stored in the supernatant at –80°C. A BCA kit was applied to measure protein concentrations. An equivalent amount of protein was loaded onto 10% SDS-polyacrylamide gel for electrophoresis, transferred to a PVDF membrane, and then sealed for 1 h at room temperature with 5% BSA. The cells were incubated overnight at 4°C with antibodies for TLR4 (1 : 100), TRIF (1 : 100), NF-κB (1 : 1 000), and GAPDH (1 : 100). The cells were then incubated with the corresponding secondary antibodies (1 : 10,000) at room temperature for 1 h. Finally, the cells were stained using an ECL kit and processed using Image-J to analyse grey levels.
Statistical analysis
The experiment data are presented as mean ± SD, and SPSS version 21.0 was employed for data analysis. One-way ANOVA was used if the data reflected a normal distribution and even variance. The rank sum test was used if the data reflected a non-normal distribution or uneven variance. For all analyses, p < 0.05 indicated that the results were of statistical significance.
Results
Influence of Alo on pathological changes in the hepatic tissues of NASH rats
Tissues in the normal group revealed hepatic cells with a normal aligned structure. The cellular boundary was clear, and the nucleus was round and clear. No fat degeneration, inflammation, or necrosis was seen. Hepatic tissues in the model group showed severe injury. A large amount of hepatic tissues revealed swelling and hydropic degeneration. Circular lipid droplets of different sizes, indicating fat degeneration of hepatic tissues, could be observed in the cytoplasm. Squeezing of the nucleus to the margin, inflammatory cell infiltration in the lobule and portal areas, and point- or strip-like necrosis of hepatic cells were also noted. Tissues in the Alo-L, Alo-M, and Alo-H groups showed obvious reductions in hepatic injury compared with those in the model group. The hepatic tissues of the Alo-treatment groups showed mild fatty lesions, and the sinusoidal structure of hepatic cells was quite clear. Lipid droplets in the cytoplasm of hepatic cells greatly decreased or disappeared completely (Figure 1).
Figure 1
Determination of pathological differences amongst groups by haematoxylin–eosin staining (200×). Normal: Rats fed a normal diet. Model: Rats fed a high-fat diet. Alo-L: Rats treated with 5 mg/kg·day Alo after feeding for 12 weeks. Alo-M: Rats treated with 25 mg/kg·day Alo after feeding for 12 weeks. Alo-H: Rats treated with 50 mg/kg·day Alo after feeding for 12 weeks
Effects of Alo on the apoptosis of cells in the hepatic tissues of NASH rats and related mRNA
TUNEL testing revealed that the apoptosis rate in the model group was remarkably increased compared with that in the normal group (p < 0.001, Figure 2 A). After Alo treatment, the apoptosis rate in the Alo-L, Alo-M, and Alo-H groups was significantly reduced compared with that in the model group (p < 0.05, p < 0.01, and p < 0.001, respectively; Figure 2 A). Significant differences were observed between the Alo-L, Alo-M, and Alo-H groups (p < 0.05 and p < 0.01; Figure 2 A). RT-qPCR testing indicated that the expression levels of TLR4, TRIF, and NF-κB genes in the model group were greatly enhanced compared with those in the normal group (p < 0.001; Figure 2 B). After Alo treatment, the expression levels of TLR4, TRIF, and NF-κB(p65) genes in the Alo-L, Alo-M, and Alo-H groups significantly decreased compared with those in the model group (p < 0.05 and p < 0.01; Figure 2 B). Significant differences were found between the Alo-L, Alo-M, and Alo-H groups (p < 0.05 and p < 0.01; Figure 2 B).
Figure 2
Determination of hepatic cell apoptosis by TUNEL assay and relative mRNA expression by RT-qPCR assay. Normal: Rats fed a normal diet. Model: Rats fed a high-fat diet. Alo-L: Rats treated with 5 mg/kg·day Alo after feeding for 12 weeks. Alo-M: Rats treated with 25 mg/kg·day Alo after feeding for 12 weeks. Alo-H: Rats treated with 50 mg/kg·day Alo after feeding for 12 weeks. A – Determination of hepatic cell apoptosis by TUNEL assay (200×). B – Determination of TLR4, TRIF, and NF-κB(p65) mRNA expression by RT-qPCR assay
***P < 0.001, compared with the normal group; #p < 0.05, ##p < 0.01, ###p < 0.001, compared with the model group; &p < 0.05, &&p < 0.01, compared with the Alo-L group; $p < 0.05, compared with the Alo-M group.
The influence of Alo on the expression of related proteins
Immunohistochemistry (IHC) examination showed that the protein expression levels of TLR4, TRIF, and NF-κB(p65) in the model group are greatly increased compared with those in the normal group (p < 0.001, Figure 3). After Alo treatment, the expression levels of TLR4, TRIF, and NF-κB(p65) genes in the Alo-L, Alo-M, and Alo-H groups greatly decreased compared with those in the model group (p < 0.05 and p < 0.01; Figure 3). Significant differences were noted amongst the Alo-L, Alo-M, and Alo-H groups (p < 0.05 and p < 0.01; Figure 3).
Figure 3
Determination of TLR4, TRIF, and NF-κB(p65) protein expression by immunohistochemistry (IHC) assay. A – Determination of TLR4 protein expression in different groups by IHC assay (200×). B – Determination of TRIF protein expression in different groups by IHC assay (200×). C – Determination of NF-κB(p65) protein expression in different groups by IHC assay (200×)
***P < 0.001, compared with the normal group; #p < 0.05, ##p < 0.01, ###p < 0.001, compared with the model group; &p < 0.05, &&p < 0.01, compared with the Alo-L group; $p < 0.05, compared with the Alo-M group.
Influence of Alo on cell apoptosis in each group
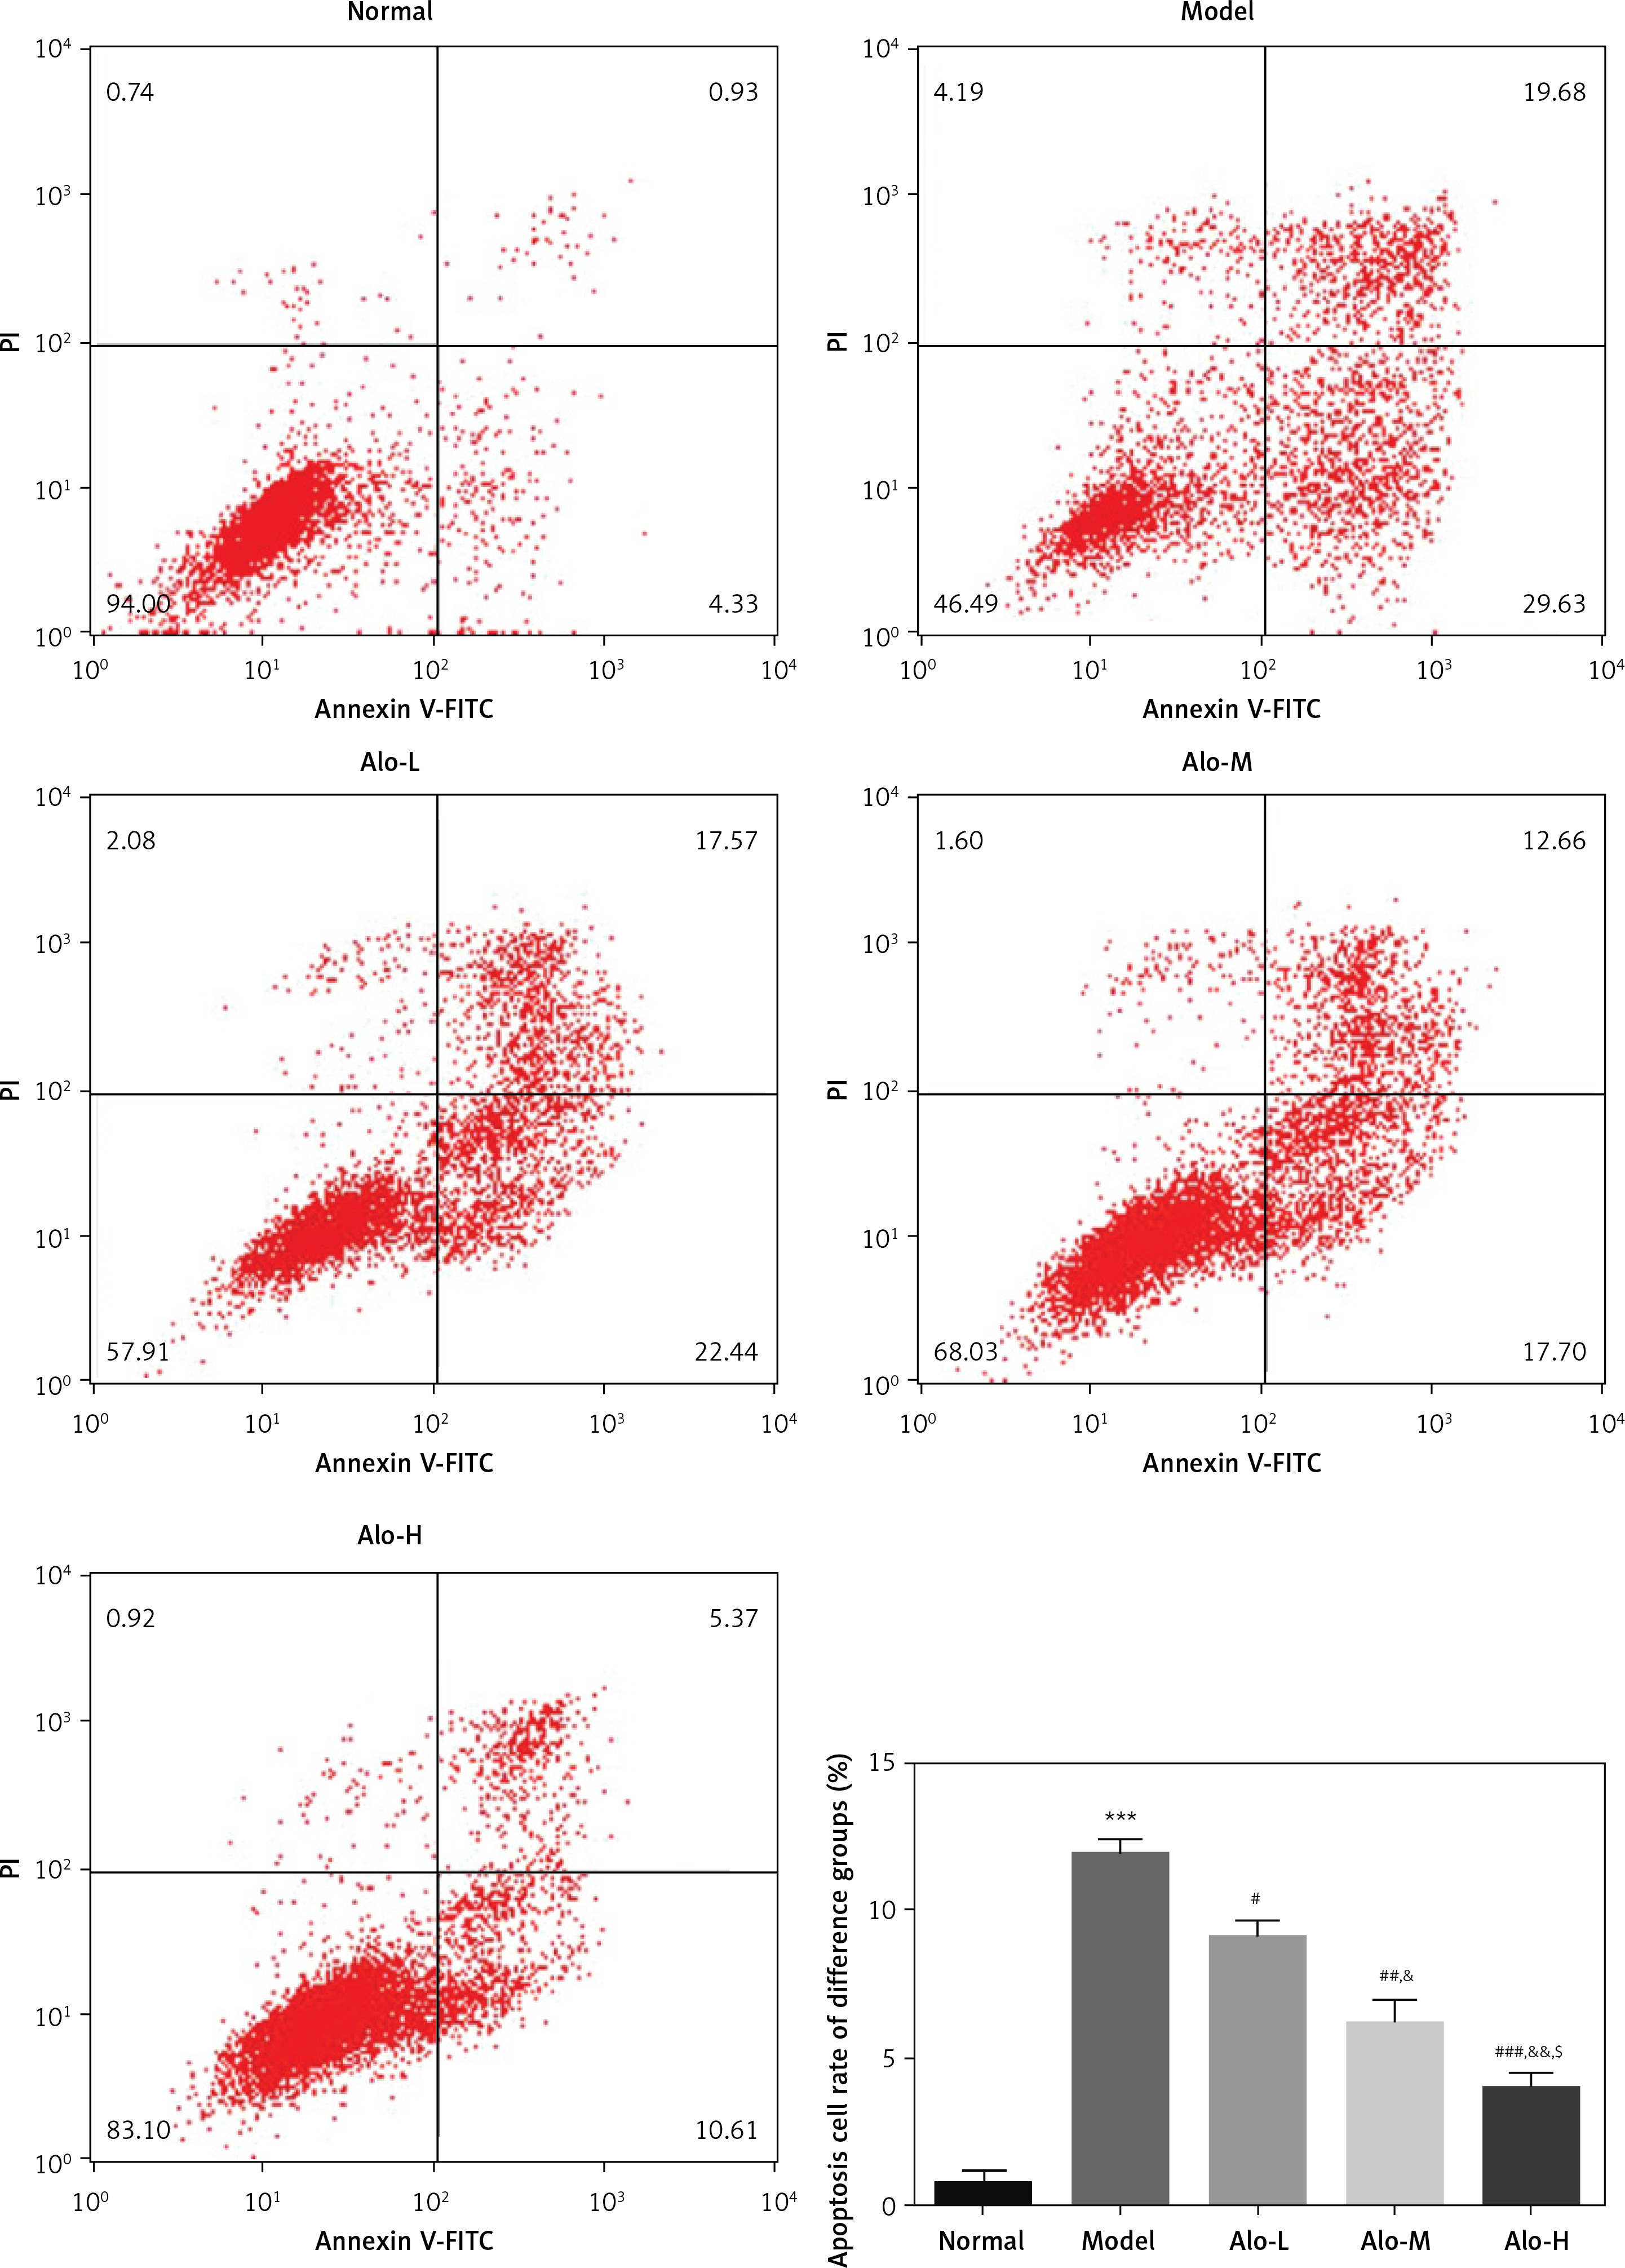
Flow cytometry demonstrated that the apoptosis rate in the model group was greatly increased compared with that in the normal group (p < 0.001; Figure 4). After Alo treatment, the apoptosis rates of hepatic tissues in the Alo-L, Alo-M, and Alo-H groups were significantly decreased compared with that in the model group (p < 0.05, p < 0.01, and p < 0.001; Figure 4). Significant differences were noted amongst the Alo-L, Alo-M, and Alo-H groups (p < 0.05 and p < 0.01; Figure 4).
Figure 4
Determination of cell apoptosis in different groups by flow cytometry. Normal: L02 cells subjected to normal treatment. Model: L02 cells treated with 500 µmol/l FFA as the NASH cell model. Alo-L: L02 cells based on the NASH cell model treated with 5 ml/l Alo. Alo-M: L02 cells based on the NASH cell model treated with 25 ml/l Alo. Alo-H: L02 cells based on the NASH cell model treated with 50 ml/l Alo
***P < 0.001, compared with the normal group; #p < 0.05, ##p < 0.01, ###p < 0.001, compared with the model group; &p < 0.05, &&p < 0.01, compared with the Alo-L group; $p < 0.05, compared with the Alo-M group.
The influence of Alo on cell-associated genes and proteins in each group
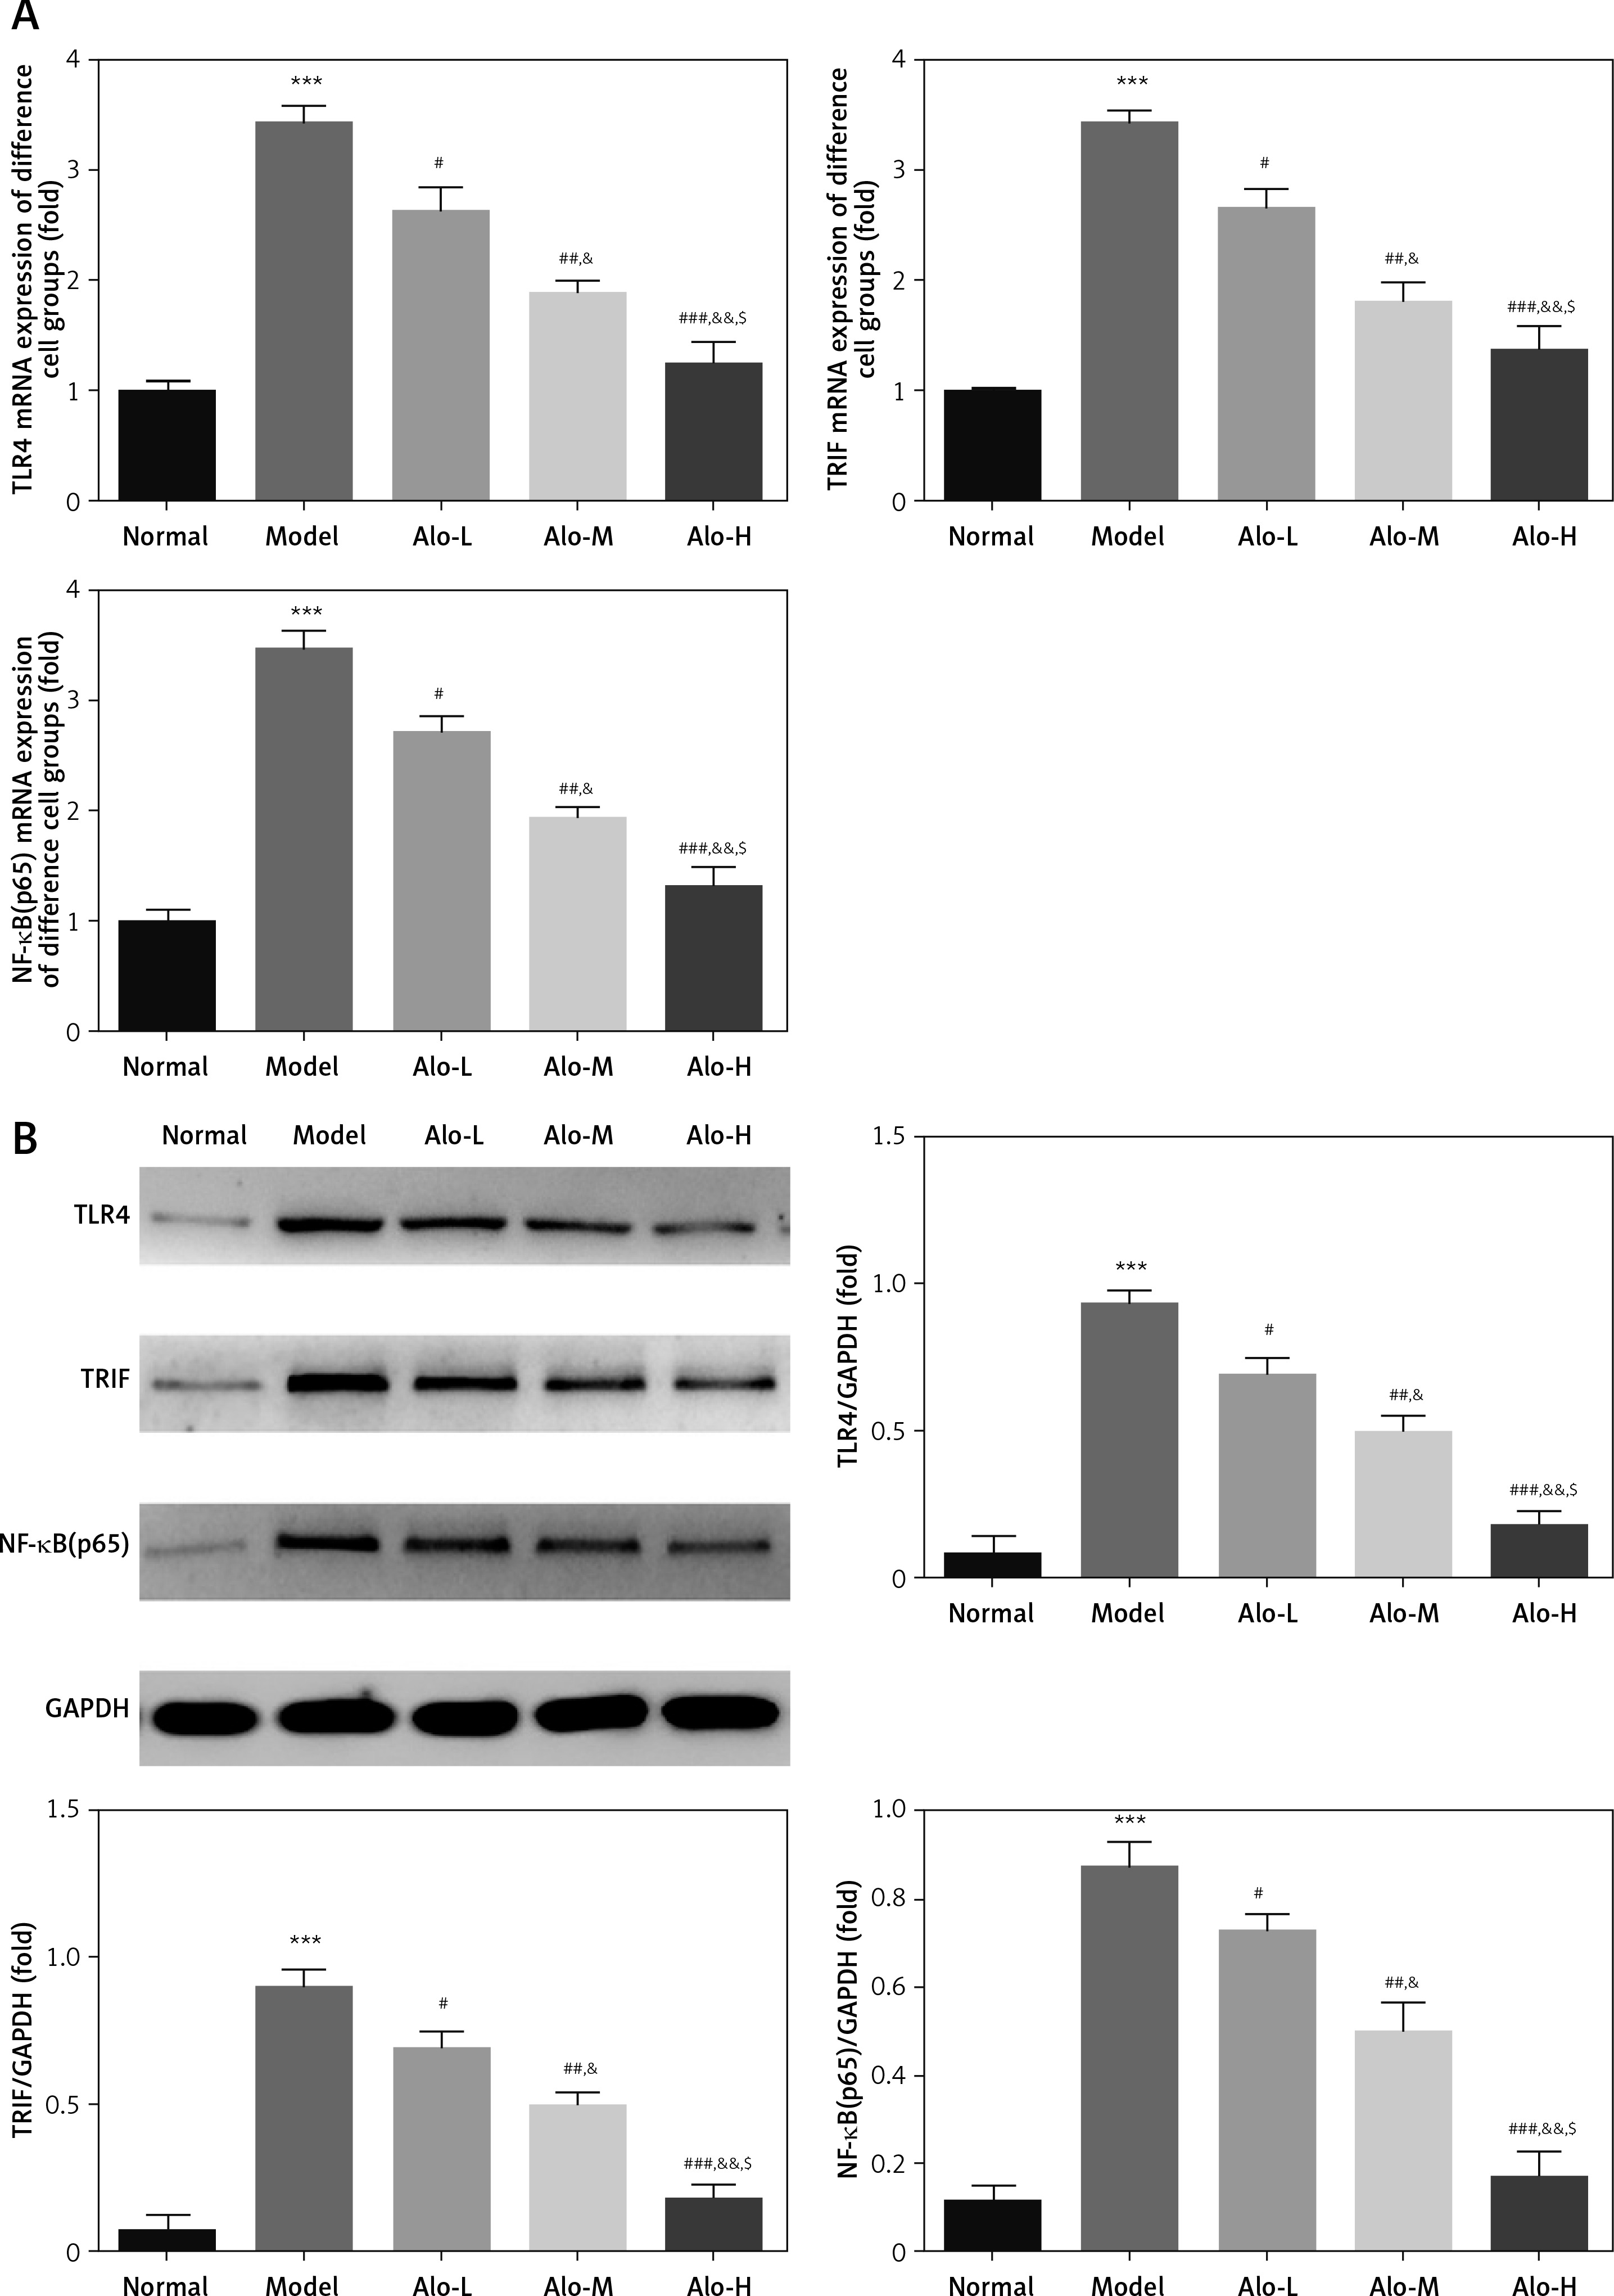
RT-qPCR and Western blot examination indicated that the expression levels of TLR4, TRIF, and NF-κB(p65) genes and proteins in the model group were greatly improved compared with those in the normal group (p < 0.001; Figures 5 A, B). After Alo treatment, the expression levels of TLR4, TRIF, and NF-κB(p65) genes and proteins in the Alo-L, Alo-M, and Alo-H groups were greatly reduced compared with those in the model group (p < 0.05 and p < 0.01; Figures 5 A, B). Significant differences were observed beween the Alo-L, Alo-M, and Alo-H groups (p < 0.05 and p < 0.01; Figures 5 A, B).
Figure 5
Determination of TLR4, TRIF, and NF-κB(p65) mRNA expression by RT-qPCR and protein expression by Western blot (WB) assay. Normal: L02 cells subjected to normal treatment. Model: L02 cells treated with 500 µmol/l FFA as the NASH cell model. Alo-L: L02 cells based on the NASH cell model treated with 5 ml/l Alo. Alo-M: L02 cells based on the NASH cell model treated with 25 ml/l Alo. Alo-H: L02 cells based on the NASH cell model treated with 50 ml/l Alo. A – Determination of TLR4, TRIF, and NF-κB mRNA expression by RT-qPCR assay. B – Determination of TLR4, TRIF, and NF-κB protein expression by WB assay
***P < 0.001, compared with the normal group; #p < 0.05, ##p < 0.01, ###p < 0.001, compared with the model group; &p < 0.05, &&p < 0.01, compared with the Alo-L group; $p < 0.05, compared with the Alo-M group.
The effects of Alo on the nuclear import volume of NF-κB(p65) protein
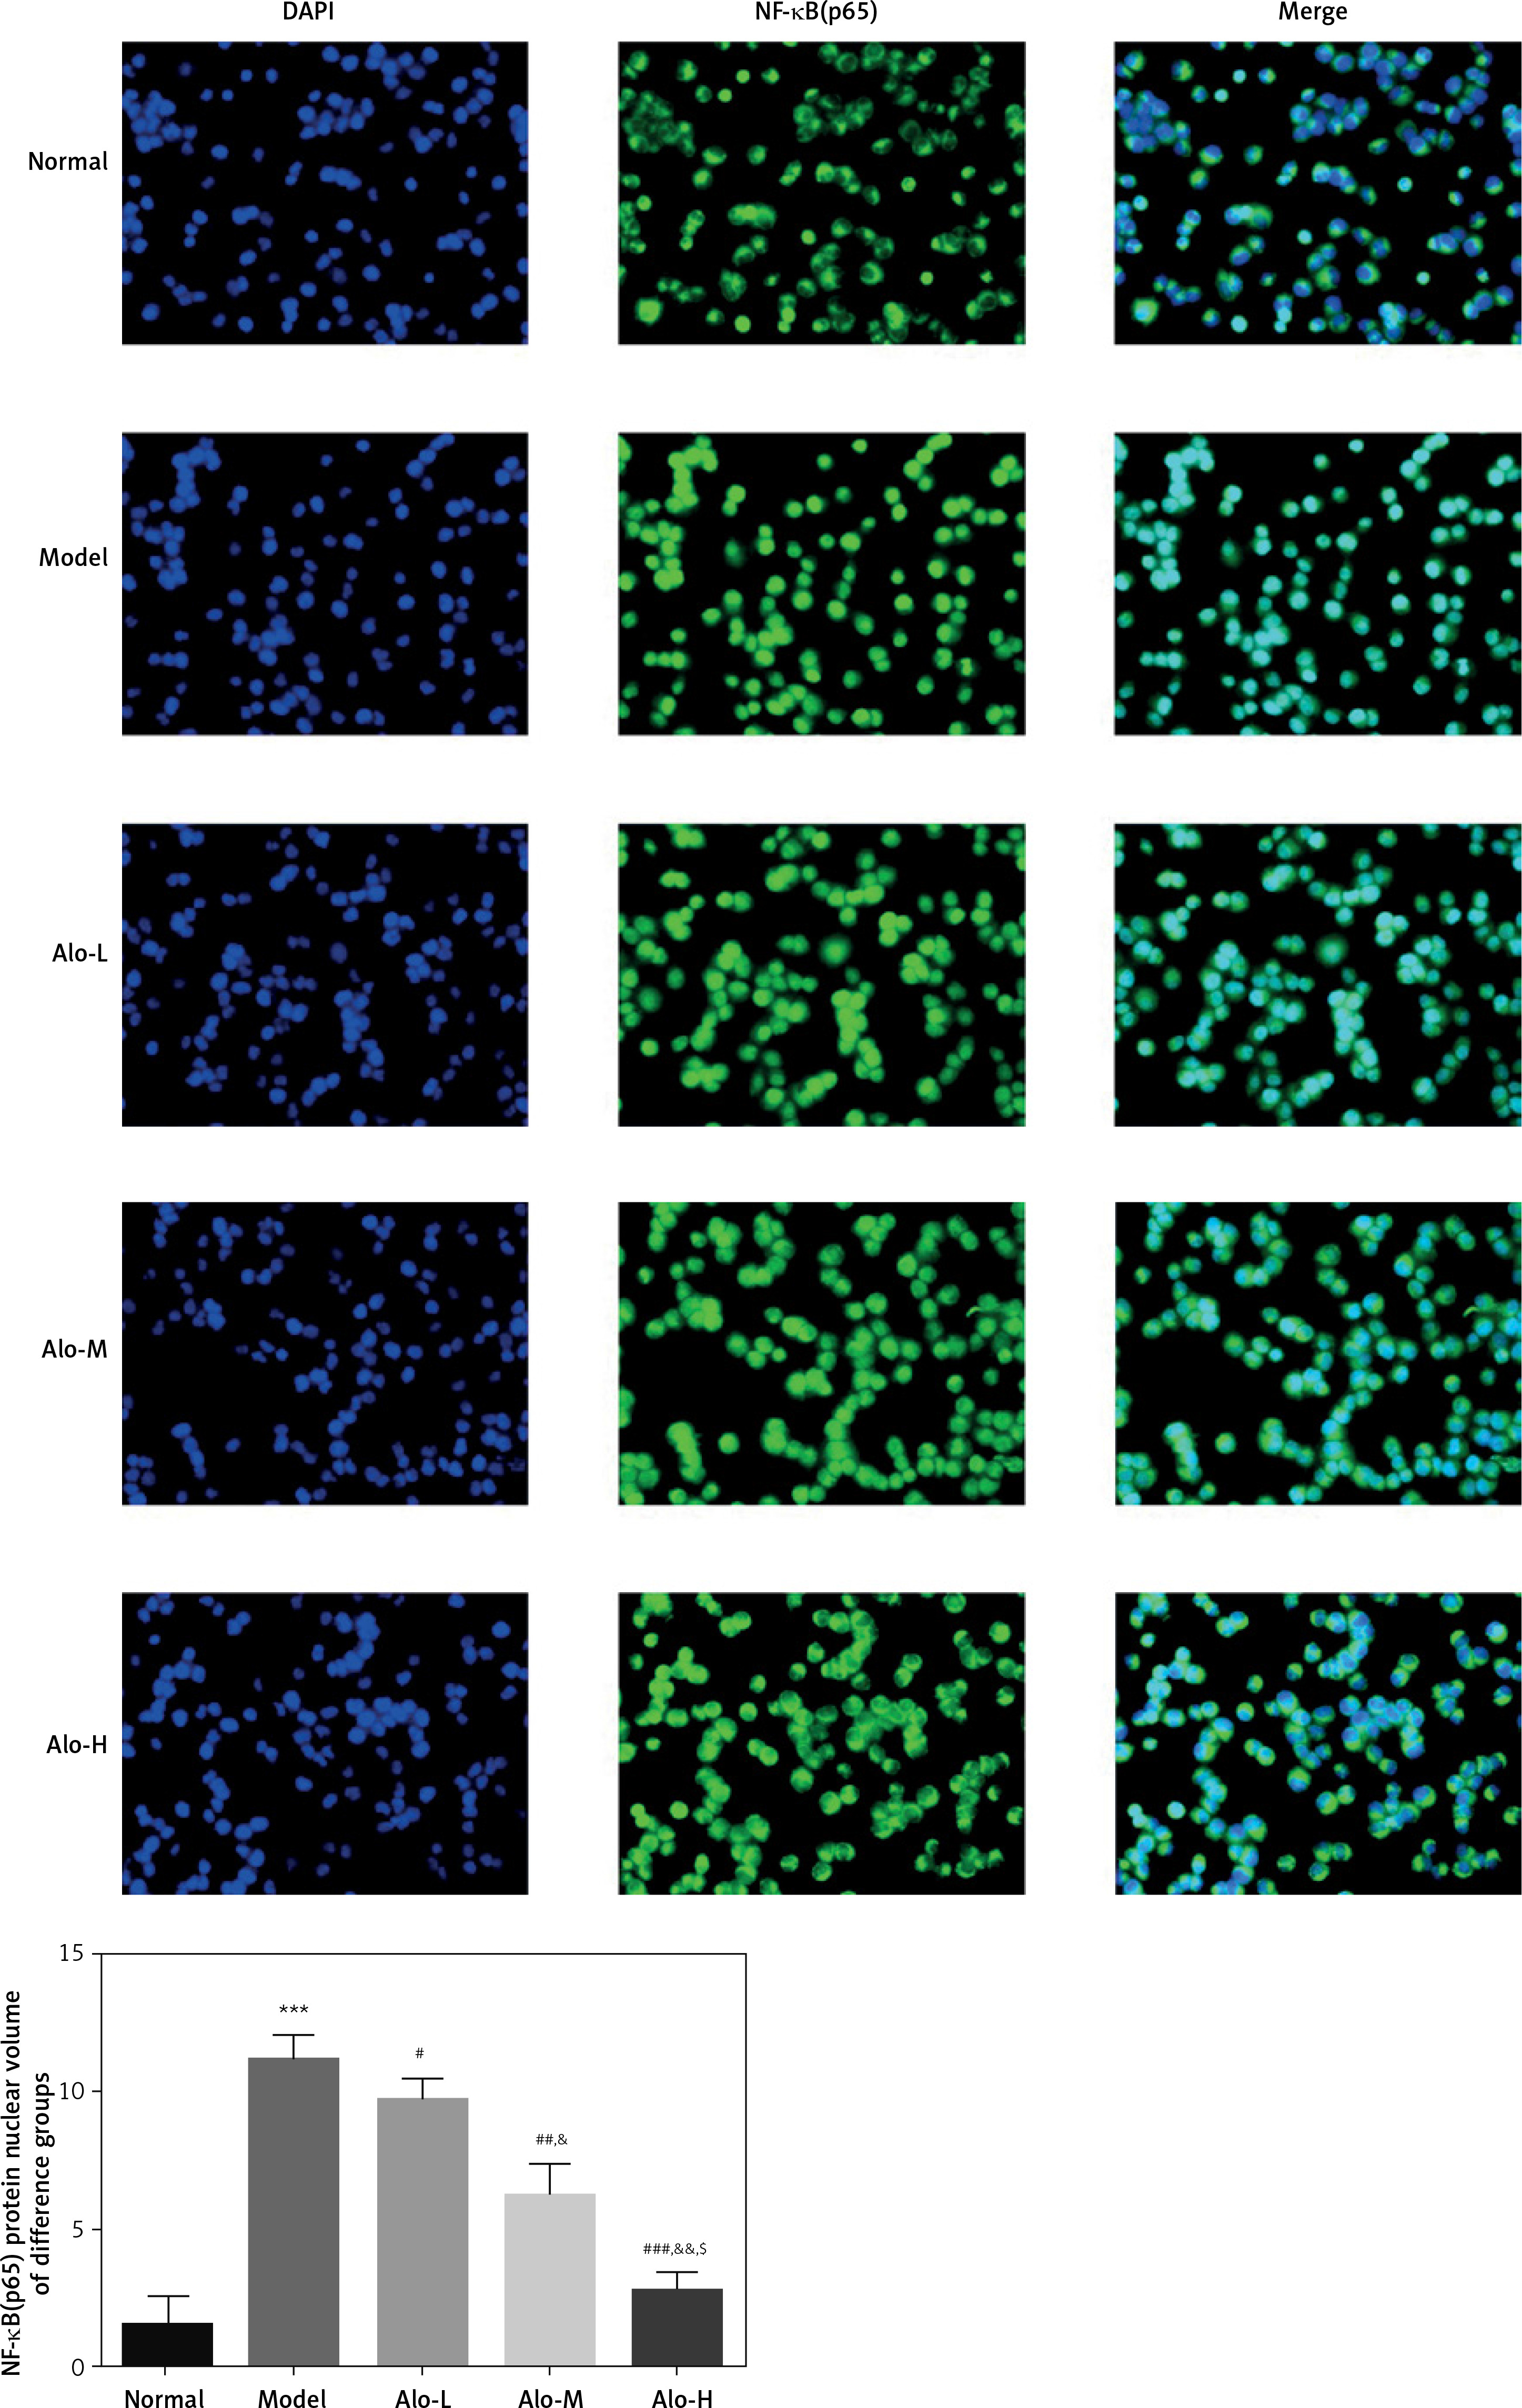
Cell immunofluorescence examination showed that the nuclear import volume of NF-κB(p65) in the model group was greatly increased compared with that in the normal group (p < 0.001; Figure 6). After Alo treatment, the nuclear import volume of NF-κB(p65) in the Alo-L, Alo-M, and Alo-H groups significantly decreased compared with that in the model group (p < 0.05 and p < 0.01; Figure 6). Significant differences were observed amongst the Alo-L, Alo-M, and Alo-H groups (p < 0.05 and p < 0.01; Figure 6).
Figure 6
Determination of the nuclear import volume of NF-κB(p65) in different groups by cell immunofluorescence. Normal: L02 cells subjected to normal treatment. Model: L02 cells treated with 500 µmol/l FFA as the NASH cell model. Alo-L: L02 cells based on the NASH cell model treated with 5 ml/l Alo. Alo-M: L02 cells based on the NASH cell model treated with 25 ml/l Alo. Alo-H: L02 cells based on the NASH cell model treated with 50 ml/l Alo.
***P < 0.001, compared with the normal group; #p < 0.05, ##p < 0.01, ###p < 0.001, compared with the model group; &p < 0.05, &&p < 0.01, compared with the Alo-L group; $p < 0.05, compared with the Alo-M group.
Discussion
TLR, a lipopolysaccharide receptor discovered in recent years, includes 10 members (TLR1–10). Amongst these receptors, TLR2 and TLR4 are the major family members. TLR2 mainly induces inflammatory reactions caused by bacterial exotoxins, whilst TLR4 mainly induces inflammatory reactions caused by bacterial endotoxins. Once TLR4 is activated through cascade reactions, a series of signal molecules are recruited in the intracellular Toll/IL-1R (TIR) structural domain, activating nuclear factor (NF)-κB and causing an inflammatory factor cascade reaction of core pro-inflammatory factors, which were mainly tumour necrosis factor α (TNF-α), forming a second hit force and leading to organism damage [10–12]. TNF-α plays a major role in its signal transduction pathway, and TNF-α could inhibit the lipid activity. Recent research shows that high concentrations of TNF-α could decrease lipolysis in peripheral tissues and promote the binding and agglomeration of hepatic tissues to triacylglycerol. Deposition of surplus lipid, especially triacylglycerol, in the liver is a precondition for NAFLD formation and development. Previous studies indicated that elevation of serum endotoxin levels is positively correlated with TNF-α levels [13–15].
Alo, one of the major alkaloids extracted from S. alopecuroides, is characterised by easy extraction and low toxicity. Relevant research has verified that Alo could efficiently improve inflammatory reactions caused by various diseases [16–18]. In this research, we confirmed that Alo could effectively facilitate the pathological status of hepatic tissues in NAFLD rats through in in vivo and in vitro experiments. TUNEL staining and flow cytometry showed that Alo could significantly improve the apoptosis caused by NAFLD in animal and cell models. To explore the related mechanism, we examined genes and proteins relevant to the TLR4/RTIF/NF-κB signal pathway in NAFLD animal and cell models and found that the expression levels of TLR4, RTIF, and NF-κB(p65) genes and proteins were greatly elevated. However, after Alo treatment, the expression levels of TLR4, RTIF, and NF-κB(p65) genes and proteins declined remarkably in a dose-dependent manner. Cell IHC testing showed that the nuclear import volume of NF-κB(p65) protein was significantly improved in the NAFLD cell model, which means increases in this protein could promote inflammation in NAFLD and thus lead to apoptosis. Interestingly, Alo treatment greatly improved this situation.
NF-κB, a heterodimer consisting of P50 and P65 subgroups, exists in the cytoplasm in an inactive form and could transform into nuclear transcription factor within the nucleus after activation. The protein complex was found to inhibit the apoptosis induced by TNF-Ct in 1996. Activated NF-κB can obstruct the apoptosis of multiple cells, and NF-κB lacking P50 is able to maintain its anti-apoptosis capability. The effect of this protein complex is believed to involve the inhibition of caspase-8 activation by anti-apoptosis proteins (TRAFl, TRAF2, c-IAPl, and c-IAP2) through caspases reaction [19, 20]. In addition, NF-κB(p65) could exert anti-apoptotic effects by inducing the expression of anti-apoptosis genes [21].
In conclusion, TRL4-induced inflammatory reactions may be one of the mechanisms of NAFLD injury. The protective role of Alo in the liver could be related to reductions in TRL4 expression and inhibition of the inflammatory reaction.