Introduction
Prostate cancer (PCa) is the most commonly diagnosed malignancy, excluding skin cancer, in men older than 70 years [1]. Prostate core needle biopsy (PCNB) is a gold standard test to diagnose PCa. Atypical small acinar proliferation (ASAP) was first described by Bostwick et al. [2] as foci of small acinar structures (< 0.4 mm) formed by atypical epithelial cells which were diagnosed on PCNB. ASAP is diagnosed in 5% of all prostate biopsies [3, 4] and considered a precancerous lesion of the prostate [5, 6]. A second prostate biopsy is routinely recommended by the current National Comprehensive Cancer Network (NCCN) and European Association of Urology (EAU) guidelines [7, 8] because of the 30–40% PCa risk in patients who had ASAP on the initial biopsy [9, 10].
Morbidity associated with PCNB is a problem for both patients and clinicians [11–13]. Some patients wish to delay a second biopsy as much as possible. Furthermore, a transrectal ultrasonography (TRUS)-guided prostate biopsy is a high-cost procedure [14]. Besides the morbidity and high costs, the results obtained through a TRUS-guided prostate biopsy do not always show a clinically significant or high-risk PCa [15]. Therefore, performing a second prostate biopsy has been a controversial topic for years.
In this study, we aimed to discuss the requirement to perform second biopsies routinely in patients with ASAP and to determine criteria for identifying patients who should absolutely undergo a second biopsy. We present a scoring system and a risk table that may offer guidance on whether a second prostate biopsy should be performed.
Material and methods
This retrospective study was conducted in accordance with the principles of the World Medical Association Declaration of Helsinki – Ethical Principles for Medical Research Involving Human Subjects.
Patient population
A TRUS-guided prostate biopsy was performed in 2,845 cases due to elevated PSA levels and/or significant digital rectal examination (DRE) findings in our clinic in the period between January 2008 and May 2019. ASAP was found in 238 out of 2,295 prostate biopsy patients. Of these 238 patients, 128 with available data were included in the study.
Inclusion and exclusion criteria
Patients who had elevated prostate-specific antigen (PSA) levels and/or abnormal findings in a digital rectal examination were included in the study. Patients with urinary tract infections, coagulopathies, a history of surgery in the past year, or patients who received 5α-reductase inhibitors as monotherapy or combination therapy, or patients with inadequate data were excluded from the study.
Study design
Patients’ medical records were retrospectively reviewed. Patients’ age, prostate volumes, total PSA (tPSA) and free PSA (fPSA) levels, the ratio of fPSA to tPSA (f/tPSA), and PSA-density (PSA-D) (ml) levels were evaluated. Additionally, PSA velocity (PSAv) was calculated for PSA types (tPSAv, fPSAv,f/tPSAv, and PSA-Dv) as the difference in the measured levels between the values obtained before the first and the second biopsies.
ASAP Scoring System and Risk Table (ASS-RT)
Patients were divided into two groups according to the results of the second prostate biopsies. Group I included patients with benign prostate pathology (prostatitis or benign prostate hyperplasia) and group II included patients with PCa diagnosed on the second prostate biopsy. We designed a scoring system and a risk table to evaluate patients with ASAP before the repeat biopsy (Table I).
Table I
ASAP Scoring System and Risk Table for patients with ASAP
Four parameters, which would be scored from 0 to 3 or 4, were selected to be used in the scoring system and the risk table. tPSA levels were was scored from 1 to 3 points according to the values of 0 – < 4 ng/dl, 4–10 ng/dl, and > 10 ng/dl, respectively. f/tPSA was scored from 1 to 3 points according to the values of < 0.15, 0.15–0.25, and > 0.25%, respectively. PSA-D was scored from 1 to 4 points according to the levels of < 0.08, 0.08–0.129, 0.13–0.15, and > 0.15 ng/dl/ml, respectively. PSAv was scored 0 or 1 points according to the decrease or increase in the levels of tPSA before the second prostate biopsy. The total ASS-RT score that could be obtained ranged from 3 to 11 points. Finally, subsequent to all assessments, the patients included in the study were categorized according to their total scores as low (3–5), intermediate (6–8), or high-risk (9–11) patients.
TRUS-guided prostate biopsy procedure
Oral administration of 500 mg levofloxacin and 400 mg etodolac was started 1 day before the procedure and continued after the biopsy. On the day of the biopsy, a rectal enema (250 ml) was performed before the biopsy. The biopsy was performed while the patient was in the left lateral position with the thighs flexed. The procedure was performed under the guidance of an ultrasound device with a 7.5 MHz biplanar probe.
The biopsy was performed under outpatient clinic conditions in a room equipped with all material necessary for potential emergency intervention. Sedation or anesthesia was not administered. Periprostatic nerve blockade was performed 10 min before the procedure in addition to the perianal and intrarectal administration of lidocaine gel. Injections were delivered through the prostate-seminal vesicle angle on each side, using 5 ml of 2% lidocaine. Biopsies were performed by more than one experienced urologist. Standard 12 or 10 core prostate biopsies were performed in initial biopsy procedures. The samples were collected from both lateral and medial aspects and from the base, apex, and medial surfaces on the right and left sides of the prostatic peripheral zone. A second prostate biopsy was performed within 3 to 6 months after the initial biopsy. The number of core samples taken at the second biopsy was 16 or 18.
Data analysis
Data were analyzed using SPSS Statistics 22.0 software (SPSS Inc., Chicago, IL, USA) and Microsoft Excel. The data were tested for normality by the Shapiro-Wilk test. Normally distributed descriptive data were presented as mean and standard deviation. Otherwise, data were presented as median and minimum-maximum values. Based on the normal or non-normal distribution of the data, Student’s t test or the Mann-Whitney U test was used to compare the first and second biopsy results. Receiver operating characteristic (ROC) curves were used to quantify the predictive accuracy of the results. Two-tailed levels of p < 0.05 were considered statistically significant.
Results
The mean age of the patients with ASAP was 62.9 ±7.8 years (40–78). In the first prostate biopsy, the mean tPSA level, fPSA level, f/tPSA ratio, and PSA-D level were 8.63 ng/ml (0.9–32.5), 1.59 ng/ml (0.0017–8.9), 0.19 (0.0014–0.79), and 0.19 ng/ml/cc (0.01–0.98), respectively. The second prostate biopsy results were reported as benign prostate pathology for 77 (60.2%) patients and PCa for 51 (39.8%) patients (ISUP Grade Group I: 36, ISUP Grade Group II: 10, and ISUP Grade Group IV: 5 patients). The mean prostate volumes in study groups I (patients with benign prostate pathology) and II (patients with PCa) were 58.96 ±30.66 ml and 47.71 ±25.44 ml, respectively. The difference in the prostate volumes between the study groups I and II was significant (p < 0.037).
According to the first biopsy results of patients with PCa, tPSA levels increased before the second prostate biopsy. However, tPSA levels were found to have decreased in patients with benign prostate pathology. The difference in the tPSA levels between the patients with PCa and benign prostate pathology was significant (p = 0.001). The increase in fPSA levels before the second prostate biopsy compared to the first biopsy results was significantly smaller in PCa compared to patients with benign prostate pathology (p = 0.002). The f/tPSA ratio decreased in group II before the second prostate biopsy but it increased in patients with benign prostate pathology with a significant difference (p = 0.001). In group II, PSA-D levels increased before the second prostate biopsy while they decreased in patients with benign prostate pathology and this difference was significant (p = 0.001) (Table II). Changes in the levels of the “PSA types” before the second prostate biopsy and respective statistical analysis results between the two groups are summarized in Table III. ASS-RT scores of the patients with PCa were significantly higher than those of the patients with benign prostate pathology (p = 0.001).
Table II
The results before the first and second biopsies and the change in measured levels between the first and second prostate biopsies
Table III
Changes in pre-biopsy levels of the “PSA types” between the first and second prostate biopsies and comparison between the two groups
| Variables | Group I (n = 77) Mean ± SD (median) | Group II (n = 51) Mean ± SD (median) | P-value |
|---|---|---|---|
| tPSAv | –2.61 ±4.79 (–1.3) | 0.29 ±2.69 (0.1) | 0.001* |
| fPSAv | 0.48 ±1.13 (0.2) | 0.24 ±1.01 (0) | 0.002* |
| f/tPSAv | 0.02 ±0.09 (0) | –0.03 ±0.1 (0) | 0.001* |
| PSA-Dv | –0.05 ±0.18 (0) | 0.01 ±0.09 (0) | 0.001* |
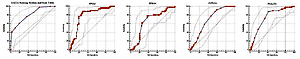
The ROC curve of ASS-RT scores was evaluated in making the diagnosis of PCa. The area under the curve was 0.804 and the standard error was 0.04. The area under the ROC curve was significantly higher than 0.5 (p = 0.001; p < 0.05). The cut-off point for the ASS-RT score in diagnosing PCa was ≥ 7. The sensitivity and specificity of the cut-off value were 60.8% and 80.5%, respectively (Figure 1).
Figure 1
ROC curve graphs of GATA Scoring System and Risk Tables score (A), tPSAv (B), fPSAv (C),f/tPSAv (D) and PSA-Dv (E) for ASAP Scoring Systemand Risk Tables score
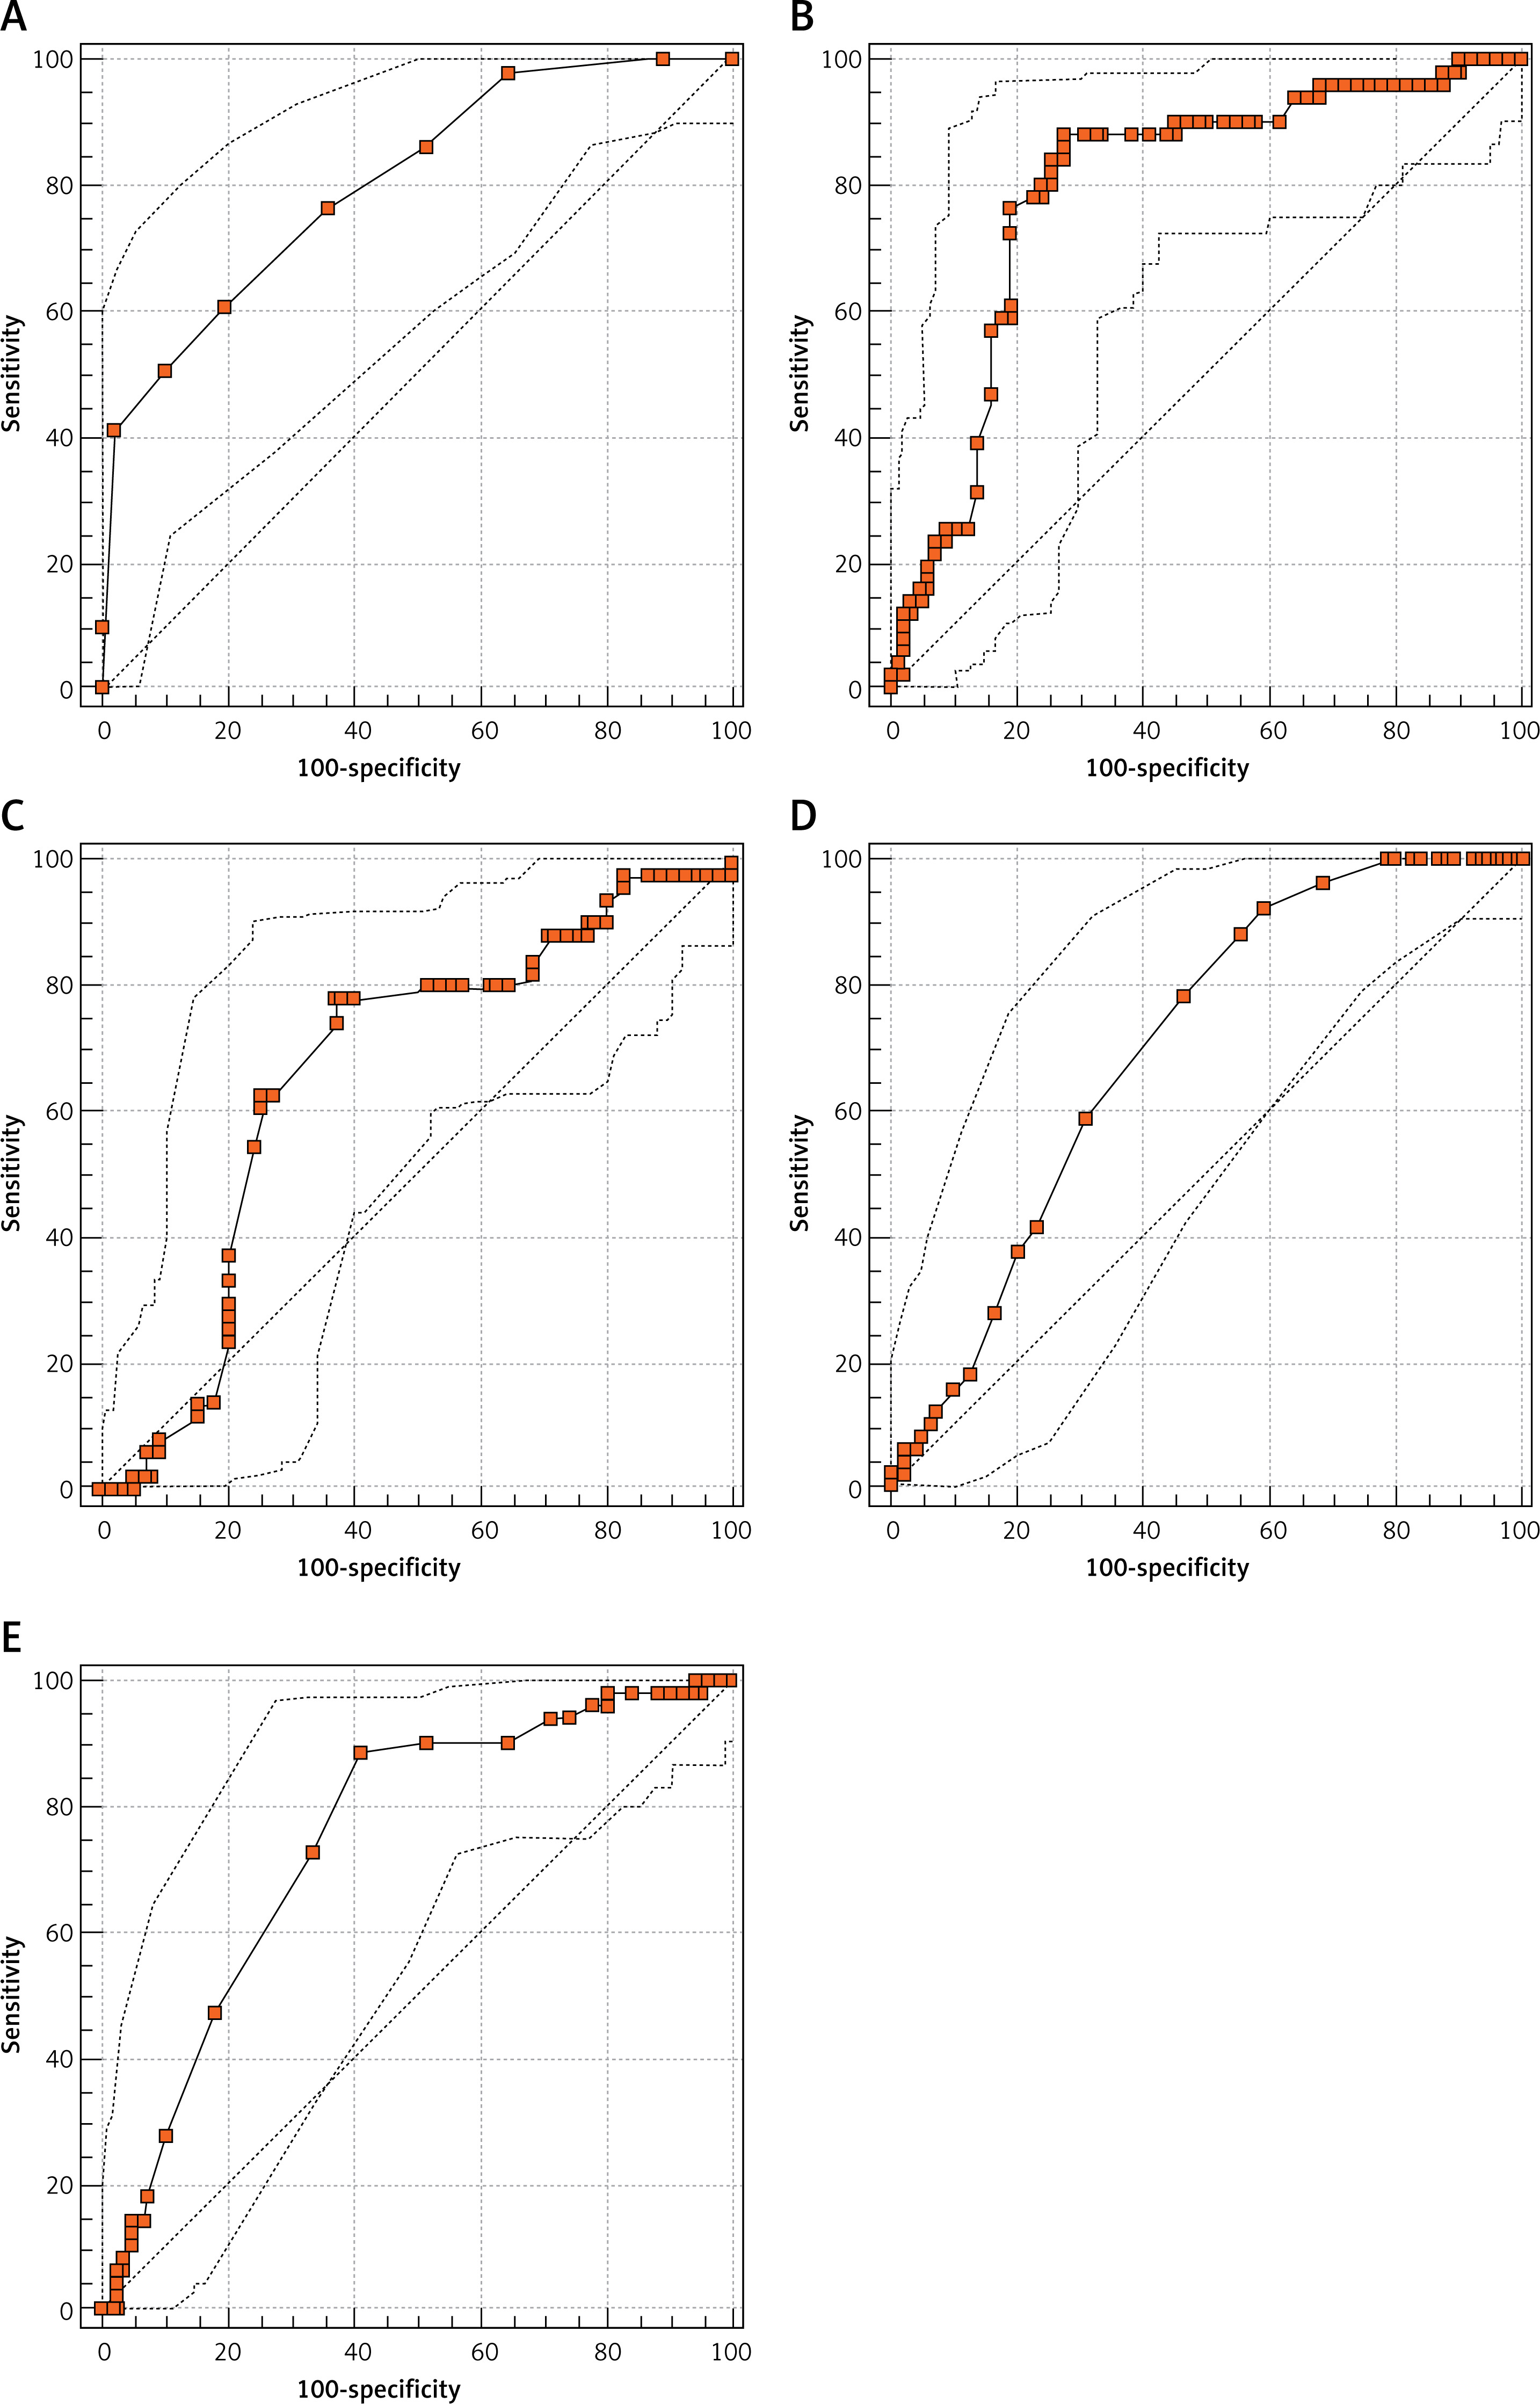
The ROC curve of tPSAv was evaluated in making a diagnosis of PCa. The area under the curve was 0.790 and the standard error was 0.04. The area under the ROC curve was significantly higher than 0.5 (p = 0.001; p < 0.05). The determined cut-off point for tPSAv in diagnosing PCa was > 0.4. The sensitivity and specificity of the cut-off value were 88.2% and 71.4%, respectively (Figure 1).
The ROC curve of fPSAv was evaluated in diagnosing PCa. The area under the curve was 0.664 and the standard error was 0.05. The area under the ROC curve was significantly higher than 0.5 (p = 0.001; p < 0.05). The determined cut-off point for fPSAv in diagnosing PCa was ≤ 0.12. The sensitivity and specificity of the cut-off value were 78.4% and 62.3%, respectively (Figure 1).
The ROC curve of f/tPSAv was evaluated in diagnosing PCa. The area under the curve was 0.696 and the standard error was 0.05. The area under the ROC curve was significantly higher than 0.5 (p = 0.001; p < 0.05). The determined cut-off point for f/tPSAv in diagnosing PCa was ≤ 0.02. The sensitivity and specificity of the cut-off value were 92.2% and 40.3%, respectively (Figure 1).
The ROC curve of PSA-Dv was evaluated in diagnosing PCa. The area under the curve was 0.745 and standard error was 0.04. The area under the ROC curve was significantly higher than 0.5 (p = 0.001; p < 0.05). The determined cut-off point for PSA-Dv in diagnosing PCa was > 0.02. The sensitivity and specificity of the cut-off value were 88.2% and 58.4%, respectively (Figure 1).
Discussion
Atypical small acinar proliferation is a pathologic entity that should be re-evaluated on a second biopsy when small foci cannot be clearly defined histopathologically and when a differential diagnosis of PCa cannot be definitively made. The detection rate of ASAP in our biopsy cohort was 11.28%. The rate of detecting ASAP has increased especially over the past few years. We think that the increased rate of detecting ASAP has resulted from the recently accepted reduction of the tPSA threshold value from 4 to 2.5 ng/ml. Second biopsy rates are reported to vary in the range of 47–63% in the literature [16]. Our re-biopsy rate, which was 53.78%, was in line with the literature. Here, the question to answer is “why do patients wish to avoid undergoing a second biopsy?”. Then, the underlying reasons should be investigated further. Indeed, because of the apparent psychological or physical difficulties that would potentially be inflicted by the biopsy procedure, it is difficult to convince patients to undergo a second biopsy. Furthermore, such a low rate reflects the public’s approach to a prostate biopsy, especially in Muslim countries. Therefore, the necessity of a second prostate biopsy is always scrutinized. Moreover, the decision to perform a second biopsy should be carefully made because a second biopsy will be associated with additional costs and the risk of morbidity.
PCa occurred in 39.84% of our patients with ASAP who underwent a second prostate biopsy. In the literature, the diagnosis rate of PCa in patients with ASAP on the second biopsy ranges from 39% to 42% [17, 18]. The relationship between ASAP and PCa has been evaluated for many years. Currently, there are no published algorithms for patients with ASAP to avoid unnecessary biopsies. Therefore, a second prostate biopsy is routinely applied to all patients diagnosed with ASAP in accordance with the recommendations in guidelines. There are many studies in the literature focusing on the diagnosis of PCa on second biopsies of patients diagnosed with ASAP. PSA types are analyzed in those studies for their potential predictive values to explain the relationship between ASAP and PCa (Table IV).
Table IV
Values of “PSA types” before the first and second prostate biopsies and by the risk groups
Several nomograms were reported to increase detection rates of PCa in recurrent prostate biopsies. In a study by Sakura et al., a new repeat biopsy nomogram was developed, using patients’ age, the f/tPSA rate, and the prostate volume, etc. [19]. However, patients diagnosed with ASAP were not included in that study. Yanke et al. and Moussa et al. reported a nomogram that contained PSA slopes and the history of a high-grade intraepithelial neoplasm or ASAP [20, 21]. A study by Lopez-Corona et al. reported a nomogram using the following parameters: the cumulative number of negative cores obtained, the PSA slope, the history of high grade prostatic intraepithelial neoplasia, and the history of ASAP. Those parameters were associated with repeat biopsy findings [22]. Those studies created nomograms using many parameters; however, such nomograms were not found adequate to be routinely recommended in the guidelines. Furthermore, the evaluation of some extra parameters would mean a cost increase. For instance, nomograms require the evaluation of PSA slopes at least three times through new measurements. Moreover, no nomograms were developed specifically for patients with ASAP and such nomograms did not address tPSA level changes between two biopsies. In our study, we have defined and used four parameters that can be measured effectively to decide whether to perform a second prostate biopsy by using the ASS-RT criteria. Compared to other systems developed for such purposes, another important feature of the ASS-RT criteria developed in our study is that these criteria identified patients by risk groups based on the points scored. We consider the risk group classification critical. Using the ASS-RT system, we compared the number of patients in both groups and found that the differences between the two study groups were significant (Table V). A study on the classification of patients with ASAP into low and high risk groups was published in 2005 by Scattoni et al., who found no difference in frequency of getting cancer between the low and high risk groups after repeated biopsies [23]. That study reported no difference between risk groups in the detection of PCa. Contrary to the study by Scattoni et al., the use of the ASAP Scoring System and Risk Table developed in our study increased the predictability of the PCa diagnosis. On the second biopsies in our study, 8% of the patients in the high-risk group had benign prostate pathology, while 50.98% (26/51) of the patients in the high-risk group had PCa. However, Gleason scores of most of the patients with PCa (70.58%) were 3+3 and the rate of a clinically significant PCa was 29.42% in group II. Unfortunately, no prediction parameters for making a diagnosis were identified for patients in the intermediate risk group.
Table V
ASAP Scoring System and Risk Table scores and comparison of the two groups
| Variable | Group 1 | Group 2 | P-value |
|---|---|---|---|
| Low risk (n = 44) | 37 (84.09%) | 7 (15.91%) | |
| Intermediate risk (n = 50) | 32 (64%) | 18 (36%) | |
| High risk (n = 34) | 8 (23.52%) | 26 (76.48%) | |
| ASAP Scoring System and Risk Table score | 5.75 (3–10) | 8.23 (4–11) | 0.001* |
Considering the relationship between ASAP and clinically insignificant PCa, patients with ASAP are not expected to have very high tPSA levels. The mean tPSA level of the cohort in our study ranged from 4.0 to 10.0 ng/ml and it was in the gray zone. A previous study reported that the rate of PCa detection was 25.1% on the first biopsy and that the rate of clinically significant PCa detection was lower in men with PSA levels of 4.0–10.0 ng/ml [24]. As mentioned previously, this rate is approximately 40% across patients diagnosed with ASAP. However, the rate of clinically significant PCa in our study was 11.71% in all patients with ASAP. Because the rate of diagnosing a clinically significant PCa on the second biopsy is less than expected in patients with ASAP, we think that the best way to prevent high costs and increased morbidity associated with re-biopsies is to identify high-risk patients through ASS-RT.
The main limitation of the study was the retrospective design. The number of patients with missing data precluded us from including more patients in the cohort. Another point that is not a limitation but an improvement factor to be considered could be the evaluation of the time elapsed between two biopsies. This factor was not examined in our study. A thorough examination of the time elapsed between two biopsies and inclusion of this factor in the ASS-RT system developed in this study may increase the effectiveness of the use of the ASS-RT table. The time between two biopsies is perhaps an effective factor in the occurrence of the final pathological diagnosis in patients diagnosed with ASAP.
In conclusion, the risk group classification of patients to be performed using ASS-RT may help identify patients who require a second biopsy. The cut-off value of 7 determined for the ASS-RT score in this study suggests that patients with ASS-RT scores of ≥ 7 should undergo a second prostate biopsy. Thereby, early diagnosis will be possible for high-risk patients. We think that there may be no need for a second biopsy if the ASS-RT score is < 7, especially for low-risk patients.