Periodontitis is a complex inflammatory disease, which has long been a major threat to human oral health. The main clinical manifestations include gingival bleeding, destruction of alveolar bone and tooth loss [1]. Additionally, recent evidence suggests that periodontitis is associated with many diseases, such as diabetes [2], Alzheimer’s disease [3], and cancer [4]. Therefore, it is important to understand the underlying molecular mechanisms and identify effective diagnostic biomarkers for periodontitis. Cuproptosis is a newly defined programmed cell death related to mitochondrial respiration, which is distinct from apoptosis, pyroptosis, ferroptosis, and necrosis [5, 6]. It is reported that the concentration of copper in oral fluid of patients displayed 5-fold increases compared with healthy people [7]. Another study using synchrotron X-ray fluorescence analysis (SXFA) to detect teeth with periodontitis also found significant copper enrichment in plaque in direct contact with cementum [8]. Several studies have shown that cuproptosis plays an important role in the pathogenesis of multiple diseases, such as cancer [9], neurodegenerative diseases [10], and periodontitis [11]. However, the role of cuproptosis in periodontitis has not been thoroughly studied. Therefore, we analyzed the single-cell sequencing data to further explore the changes of cuproptosis-related genes in periodontitis, and constructed a mouse periodontitis model to explore the changes of cuproptosis-related genes in animal models.
Methods
Data collection
The gene expression profiles were obtained from the GEO database (https://www.ncbi.nlm.nih.gov/geo/). Two transcriptomic datasets (GSE16134, GSE10334), a single-cell RNA sequencing dataset (GSE171213) and the miRNA expression profile (GSE54710) related to periodontitis were included in this study for in-depth analysis (Supplementary Table SI).
Real-time PCR analysis of key genes
In this study, 6-week-old male C57BL/6 mice were used to build the periodontitis model (Jackson Laboratory). After anesthetizing mice with isoflurane inhalation, 10 µl of LPS (1 mg/ml, Sigma, L3129) was injected locally into the bilateral palatal mucosa between the first and second maxillary molars. The mice in the control group were all given phosphate buffered saline at an equal volume. All the injections were given once a day for a week. Total RNA was extracted from mouse gingival tissue using Total RNA Extraction Reagent (Vazyme, R401-01). The extracted RNA was reverse-transcribed into cDNA using a MonScript 5× RTIII All-in-One Mix (Monad, MR05001). All primer sequences were synthesized by GENEWIZ (Suzhou, China) and are listed in Supplementary Table SII. Statistical analyses were conducted by GraphPad Prism, and data were presented as the mean ± SEM. Statistical significance of differences was determined using Student’s t-test (*p < 0.05, **p < 0.01).
Results
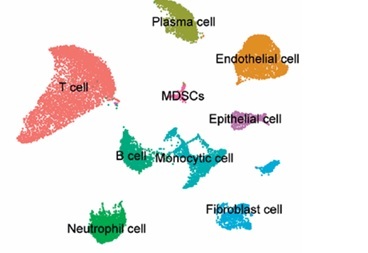
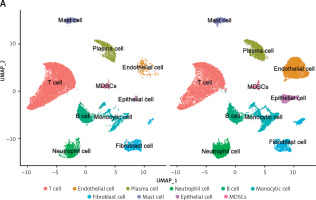
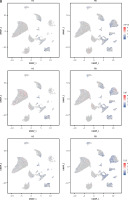
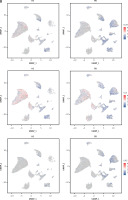
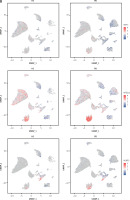
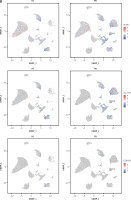
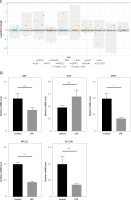
To investigate the status of cuproptosis in the progression of periodontitis, a total of 17 genes that correlated with cuproptosis were included in our study (Supplementary Table SIII). In the GSE16134 dataset, we screened 13 differentially expressed CRGs (DE-CRGs): 5 genes were upregulated, and 8 genes were downregulated (Supplementary Figure S1). We calculated the Pearson correlation coefficient for each pair of genes. The correlation network revealed that most of the DE-CRGs were highly correlated with each other. In order to further characterize the DE-CRGs among different cells in periodontitis tissues, the single-cell RNA sequencing dataset GSE171213 was analyzed. The UMAP algorithm was used to visualize the cell clusters (Figure 1 A). Next, we observed expression of 12 of the 13 DE-CRGS genes in different cell types (Figure 1 B). The volcano plot showed the differential expression of DE-CRGS in different cell types in different samples (Figure 1 C). The results showed that DE-CRGs were significantly altered in monocytes, with eight genes significantly up-regulated.
Figure 1
Single-cell analysis of CRGs in different cell types. A – UMAP plot illustrating ten identified first level cell types. B – Expression of CRGs at the cellular level of the periodontitis group and the normal group. C – Volcano plot showing the CRGs in 10 cell clusters. D – Expression levels of five signature genes in experimental periodontitis microenvironment (n = 3). Data are presented as mean ± SEM and were analyzed using paired two-way Student’s t-test. *P < 0.05, ***p < 0.001
To further explore the alterations in the immunity in periodontitis, we calculated 22 immune cell proportions based on CIBERSORT (Supplementary Figure S2). We explored the relationship between the DE-CRGs and the immune infiltrates. M1 macrophages, plasma cells, resting mast cells, and resting dendritic cells were significantly correlated with DE-CRGs. A strong correlation was observed between NFE2L2 and resting dendritic cells (r = 0.69) as well as between NFE2L2 and plasma cells (r = –0.55).
To determine the diagnostic value of DE-CRGs in periodontitis, univariate logistic regression analysis was performed for each gene. The results showed that all the DE-CRGs had good diagnostic performances in the training set (AUC > 0.6, Supplementary Figure S3). Next, we used stepwise regression analysis to screen genes to construct the best model. DBT, DLST, MTF1, NFE2L2, and SLC31A1 were retained for the further diagnostic model (Table I). In the training cohort, AUC was 0.908. The model responded well to the validation set samples, with an AUC of 0.902.
Table I
Coefficients of the signatures included in model
| Gene | Estimate | Std. error | z value | Pr (>|z|) |
|---|---|---|---|---|
| DBT | –2.0638 | 0.9232 | –2.235 | 0.02539 |
| DLST | –1.9176 | 0.4236 | –4.527 | 5.99E–06 |
| MTF1 | 2.8386 | 0.6872 | 4.131 | 3.62E–05 |
| NFE2L2 | 4.2035 | 0.9133 | 4.603 | 4.17E–06 |
| SLC31A1 | 3.5773 | 1.2724 | 2.811 | 0.00493 |
To deeply investigate the varying patterns of CRGs in periodontitis, we employed the unsupervised consensus clustering algorithm to classify 241 diseased samples based on the expression profile of the 13 DE-CRGs (Supplementary Figure S4). The results showed that the stability was highest when the samples were subdivided into two clusters. We investigated the expression patterns of the DE-CRGs between cluster 1 and cluster 2 (Supplementary Figure S5). Specifically, the bulk of CRGs showed higher expression, whereas NLRP3 and CDKN2A gene expression levels were lower in cluster 1 than that in cluster 2. GO and KEGG revealed that the differentially expressed genes were significantly enriched in structural constituent of skin epidermis and natural killer cell mediated cytotoxicity.
We calculated the proportion of immune cells to identify the immune characteristics associated with sub-types (Supplementary Figure S6). Plasma cells, monocytes, and resting mast cells were higher in cluster 1, while memory B cells, CD4+ memory activated T cells, regulatory T cells (Tregs), activated mast cells, and neutrophils were higher in cluster 2. Additionally, cluster 2 had significantly higher immune scores than cluster 1. The results showed that CRGs had a close correlation with immune cells, indicating that CRGs might influence the immune infiltration status of periodontitis patients.
A total of 36 up-regulated DE-miRNAs and 20 down-regulated DE-miRNAs were obtained from GSE54710 (Supplementary Figure S7). The ceRNA network consists of 1 lncRNA node, 12 miRNA nodes, 11 mRNA nodes, and 21 edges (Supplementary Figure S8). In order to further validate the five signature genes in the diagnostic model, we detected their expression levels in normal gingival tissues and periodontitis tissues (Figure 1 D). The RT-PCR results showed that NFE2L2 and MTF1 were significantly downregulated. The expression levels of the other three genes (DBT, DLST and SLC31A1) showed no significant differences between healthy and periodontitis tissues, but the variation trends in the expression of these genes were consistent with the result of bioinformatics analysis.
Discussion
Periodontitis is a complex and destructive disease, which not only damages the periodontal supporting tissue, but also is closely related to many systemic diseases [12–14]. Although doctors solved the problem of tooth loss through implantation technology, they did not completely solve the problem of periodontal health of patients [15]. The discovery of cuproptosis sheds new light on the study of periodontitis. Previous studies have found that cuproptosis is involved in periodontitis at the transcriptome level [11], and this study supplements single-cell sequencing data to further analyze changes in gene expression levels. Single-cell sequencing demonstrated upregulation of most CRGs in various cell types within periodontitis tissue, indicating a close association between cuproptosis and periodontitis. These conclusions further highlighted that CRGs might play an important role in periodontitis.
Our study identified the diagnostic signatures associated with cuproptosis by logistic regression and established a diagnostic model. Five genes – DBT, DLST, MTF1, NFE2L2, and SLC31A1 – were screened to construct a diagnostic model. NFE2L2, also known as Nrf2, was significantly upregulated in the in vitro periodontal disease model, and activation of the Nrf2 signaling pathway was closely related to the innate immune response, suggesting that Nrf2 may be critical in reducing inflammation in periodontitis [16, 17]. It has been reported that macrophages upregulate SLC31A1, resulting in increased surface CTR1 in response to bacterial infection [18]. This implied that SLC31A1 may be a novel therapeutic target against oral dysbiosis. Although there is a lack of corresponding evidence that the other genes are closely associated with periodontitis, they showed a satisfactory diagnostic effect.
Another finding of the current study was the identification of key miRNAs and lncRNAs involved in the progression of periodontitis, providing new strategies for disease treatment. A previous study revealed that hsa-miR-203/GLS regulatory axis plays a vital role in drug sensitivity in malignant melanoma [19]. An in vivo study demonstrated that hsa-miR-203 was downregulated in periodontal ligament cells (PDLCs) stimulated by Porphyromonas gingivalis lipopolysaccharide. Hsa-miR-203 promoted the differentiation of PDLCs by down-regulating AP-1/ICAM-1, thus alleviating periodontitis [20]. We hypothesize that hsa-miR-203/GLS might be a key regulatory pathway in the pathogenesis of early periodontitis.
Furthermore, this study is the first to verify changes of CRGs in a mouse model with periodontitis. Although three genes did not show significant differences, a trend of gene change was observed, providing important new insights into the regulation of the onset and progression of periodontitis.
This study has certain limitations. The short-term model construction employed in this study was insufficient to fully simulate chronic periodontitis. Therefore, the subsequent utilization of long-term periodontitis models or collection of clinical gingival tissue samples would be more conducive to investigating cuproptosis in periodontitis.
In conclusion, the present study suggested that cuproptosis is an important player in the pathophysiological process of periodontitis. The findings will enhance our understanding of the pathogenesis of periodontitis and provide novel insights for targeted therapy.


