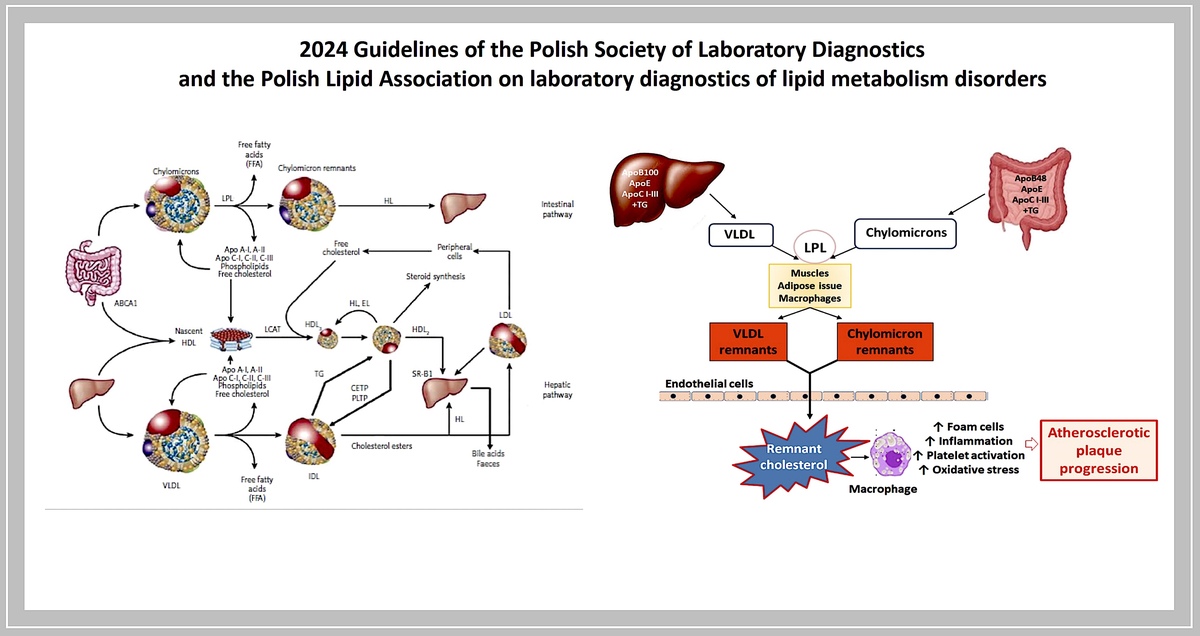
Introduction
The lipid profile routinely performed to assess cardiovascular risk involves the measurement/calculation of serum/plasma levels of total cholesterol (TC), high-density lipoprotein cholesterol (HDL-C), low-density lipoprotein cholesterol (LDL-C), triglycerides (TG) and non-HDL cholesterol (non-HDL-C), although LDL-C level is still the most important factor in both the diagnosis and monitoring of the course and treatment of lipid disorders and the prediction of cardiovascular incidents [1–4]. It is worth emphasising, however, that since 2021 non-HDL-C has been treated as equivalent to LDL-C in the assessment of the lipid profile [5]. Similarly, there is no longer any doubt that it would be optimal to assess the number of atherogenic lipoprotein particles (rather than the mass of their components). Determination of apolipoprotein B (apoB) is still not a regular part of the lipid profile.
The results of lipid profile determinations indirectly, and approximately, reflect the content of the individual lipoproteins in the blood. Of particular importance in the laboratory assessment of lipid metabolism and the risk of progression of atherosclerosis is the quantitative measurement of atherogenic lipoproteins, i.e. LDL, lipoprotein(a) [Lp(a)], chylomicron (CM) remnants and very low-density lipoprotein (VLDL) remnants [2, 3]. This is why lipid profile, which usually applies only to LDL, should be augmented, whenever possible, by measurement of Lp(a), as well as assessment of triglyceride-rich lipoproteins (CM and VLDL) and their remnants.
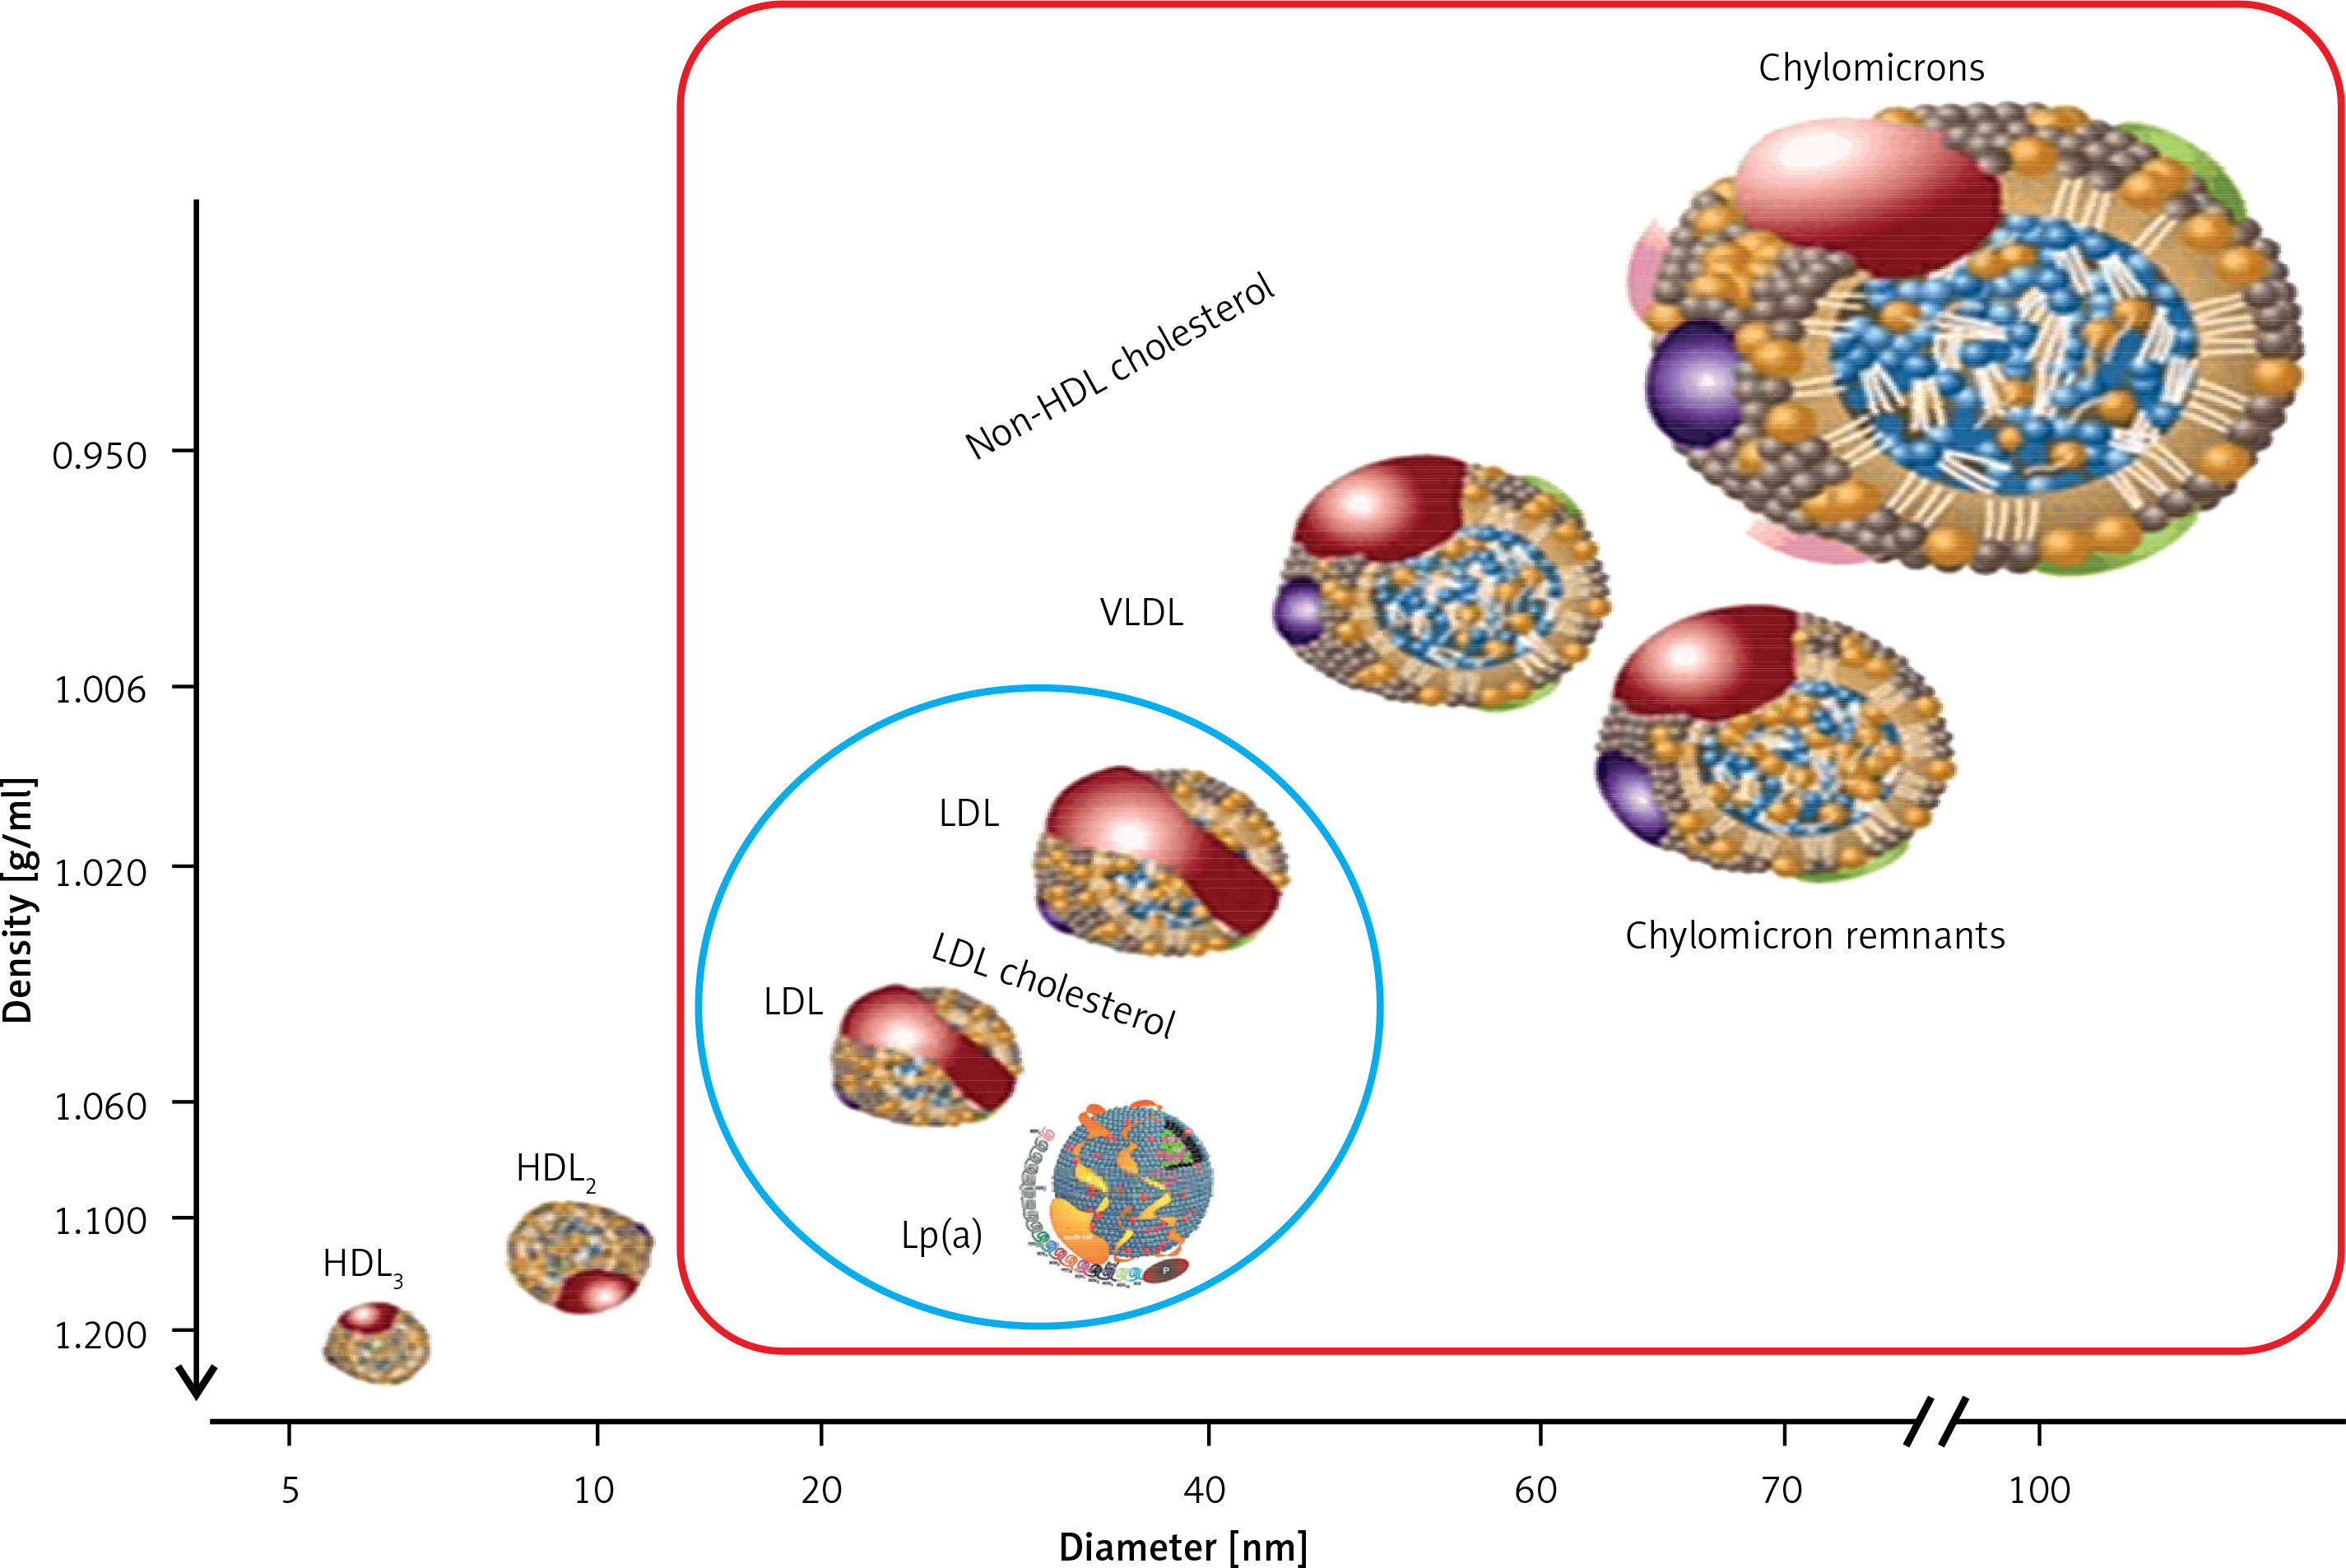
Lipoproteins are a family of macromolecular structures composed of an ‘envelope’, containing phospholipids and free cholesterol, and a core composed of TG and cholesterol esters. The lipid part is bound to specific proteins – apolipoproteins (apo), which determine the physical and biological properties of lipoproteins. Lipids and proteins are not covalently attached to each other. The structure of lipoproteins is maintained primarily by hydrophobic interactions between the nonpolar components of lipids and proteins. The classification of lipoproteins reflects both their particle size and density in the aqueous plasma environment, as well as their apolipoprotein content (Figure 1). Triglyceride-rich CM and VLDL, as well as CM and VLDL remnants have a density of less than 1.006 g/ml. LDL, HDL and Lp(a) are lipoproteins with a density of over 1.006 g/ml.
Figure 1
Plasma lipoprotein particles size and density with the cholesterol they contain as a marker of their plasma levels
The lipid transport system involving lipoproteins has two main functions:
– transport of triglycerides from the intestine and liver to adipose tissue and muscles (intestinal pathway);
– supply of cholesterol to the peripheral tissues where it is essential for the formation of cell membranes and biosynthesis of steroid hormones, and also to the liver where it is used for the synthesis of bile acids (hepatic pathway) (Figure 2).
Dietary TGs are hydrolysed in the intestine into free fatty acids (FFA), mono- and diglycerides, absorbed together with exogenous cholesterol by enterocytes, where the CM that transport them are formed, and subsequently enter the circulation via the lymphatic system. Lipoprotein lipase (LPL) bound to the capillary endothelium of the adipose tissue and muscles hydrolyses the TG they contain into glycerol and FFA, with the formation of CM remnants. HDL particles are formed in the liver and intestine, and in the course of CM and VLDL degradation, from their superficial phospholipids and free cholesterol. The free cholesterol is taken up from peripheral cells (including macrophages in the vascular wall) by nascent-HDL and HDL3 subfraction, with the involvement of ATP-binding cassette transporter A-I (ABCA1) which binds to apolipoprotein A-I (apoA-I) and is then esterified by plasma lecithin-cholesterol acyltransferase (LCAT). Cholesterol esters are transported by mature HDL2 bound by the SR-B1 receptor in hepatocytes, where they are used for bile acid synthesis. This is a so-called direct mechanism of reverse cholesterol transport. By an indirect mechanism, cholesteryl ester transfer protein (CETP) transfers cholesterol esters from HDL to apoB-containing lipoproteins with simultaneous exchange for TG. Lipoproteins containing apoB are taken up by the liver via LDL receptors (LDLR), as well as LDL receptor-like protein (LRP) and other membrane receptors. TG hydrolysis in HDL2 by hepatic lipase (HL) leads to the formation of HDL3 (Figure 2).
Figure 2
Lipoprotein metabolism
ABC A1 – ATP-binding cassette transporter A1, CETP – cholesterol ester transporter protein, EL – endothelial lipase, HL – hepatic lipase, LCAT – lecithin cholesterol acyltransferase, LPL – lipoprotein lipase, PLTP – phospholipid transport protein, TG – triglycerides.

Currently available analytical methods provide only indirect, approximate insight into the transformation of both cholesterol and TG, or the metabolism and functions of lipoproteins. In clinical practice, the diagnostics of lipid metabolism disorders is a part of the assessment and control of the risk of atherosclerosis and atherosclerotic cardiovascular disease (ASCVD). Hence, the main goal of laboratory work-up for dyslipidaemia, defined as a condition in which blood lipid and lipoprotein levels are outside the desirable range, is aimed at measuring the amount of atherogenic lipoproteins in the blood. The methodological approach to lipoprotein measurement is varied at present. Their level in the blood can be determined directly as the number of particles (LDL-P, HDL-P, Lp(a)-P) or their concentration [Lp(a)] or assessed indirectly by determining the concentration of the components of individual lipoproteins - cholesterol or apolipoprotein (apoB, apoA-I).
Organisation of the guidelines
The members of the Steering Committee who prepared these guidelines were selected by the Polish Society of Laboratory Diagnostics (PSLD) and the Polish Lipid Association (PoLA) as experts in the diagnosis and treatment of lipid metabolism disorders. The Steering Committee has carried out a detailed review of the published scientific evidence on the management of dyslipidemia, including its diagnosis, treatment, monitoring, and prevention, as well as a critical evaluation of the diagnostic and therapeutic procedures, including risk-benefit assessment. Every chapter is summarised in a box containing clear and easy to understand recommendations, highlighting the information that needs to be remembered and the key points of the recommendation. This document is a supplemented version of the guidelines first published in this form in 2020 [6, 7].
The experts from the teams that developed and peer-reviewed the guidelines completed the conflict-of-interest forms with regard to all relationships which might be perceived as actual or potential sources of conflicts of interest. The final version of the document is published in the Diagnostyka Laboratoryjna (Journal of Laboratory Diagnostics), indicated by PSLD and Archives of Medical Science (indicated by PoLA).
Laboratory diagnosticians and physicians of various specialties who deal with patients with lipid disorders are encouraged to fully consider these guidelines when conducting clinical assessments, as well as defining and implementing medical prevention, diagnosis, or treatment strategies. Nevertheless, the guidelines in no way absolve physicians from individual responsibility for making correct and accurate decisions, considering the patient’s health status, and in consultation with the patient and, if necessary, with his/her caregiver. Healthcare professionals are responsible for verification of policies and regulations pertaining to medicines and devices in effect at the time of their prescription and/or use.
Pre-analytical considerations
Tests comprising lipid profile, both standard (TC, HDL-C, LDL-C, non-HDL TG) and additional measurements of apoB and Lp(a), are performed in serum or plasma. The general approach to the pre-analytical phase is based on the assumption that lipid profile should be assessed in the setting of everyday activity and diet, and people are not required to fast for about 16 h [8, 9]. Therefore, blood samples for these tests do not need to be collected when fasting [10]. This approach is also recommended in the 2019 position statement of the European Atherosclerosis Society (EAS) (2019) and the European Federation of Clinical Chemistry and Laboratory Medicine (EFLM) of 2016, which was based on data indicating that a slight postprandial increase in the TG level (to 27 mg/dl (0.3 mmol/l) does not result in significant changes in other measurements, or in the lipid profile assessment compared to the testing of fasting samples. Small differences in the interpretation of results pertain to TG and non-HDL-C. It is recommended that lipid profile be repeated in the fasting sample if the non-fasting TG level is > 400 mg/dl (4.5 mmol/l) [2, 10].
Recommendations
Routine lipid profile testing, primarily LDL-C and TC, does not require fasting samples. Re-testing for correct measurement of LDL cholesterol using material collected in the fasting state should be considered if non-fasting TG is > 400 mg/dl (4.5 mmol/l).
The levels of individual lipid profile components are characterised by intra-individual variability of 5–10% for TC and > 20% for TG. In addition to genetically determined mechanisms of lipid metabolism regulation, variability in TC levels is also caused by environmental factors such as physical activity, diet, smoking or long-term alcohol abuse, while variability in TG levels is affected by diet, including carbohydrate and alcohol intake, and physical activity. Changes in lipid profile occur during pregnancy, especially in the third trimester, and include predominantly an increase in the TG level (observed increase of up to 250%), TC and Lp(a) levels, and to a lesser degree the LDL-C (usually not more than 30%) and HDL-C levels [11]. Seasonal variation is also observed, with increases in TC and TG levels during winter [9, 4, 12]. The TC and LDL-C levels may be lower for several weeks after a CV event and in the course of chronic inflammation, e.g. rheumatic disease (lipid paradox), as well as in the elderly, especially over 75 years old [13, 14].
Due to the fact that cholesterol and TG are components of macromolecular lipoproteins, wearing a constricting band for ≥ 3 min or remaining in the standing position for more than 30 min before blood sampling may cause a 10–12% increase in their levels as a result of the so-called haemocentration effect. Serum levels of TC, HDL-C, LDL-C and TG are approximately 3% higher than the plasma levels. Serum or plasma samples may be stored at a refrigeration temperature (+4°C) for up to 4 days. Longer storage requires freezing at –70°C.
Triglycerides
Triglycerides (TG), triacylglycerols, glycerol and esters of long-chain fatty acids are the primary components of the adipose cells and the main source of energy for the body. TG are transported in the blood by chylomicrons formed in enterocytes, very low-density lipoproteins synthesised in the liver which, together with their metabolic products i.e. remnants, are referred to as triglyceride-rich lipoproteins (TRL). CM secretion is largely regulated by food intake, whereas VLDL secretion is controlled by insulin. TRL levels are also associated with a postprandial increase in TG level and approximately 80% of this increase is attributable to TG contained in TRL remnants.
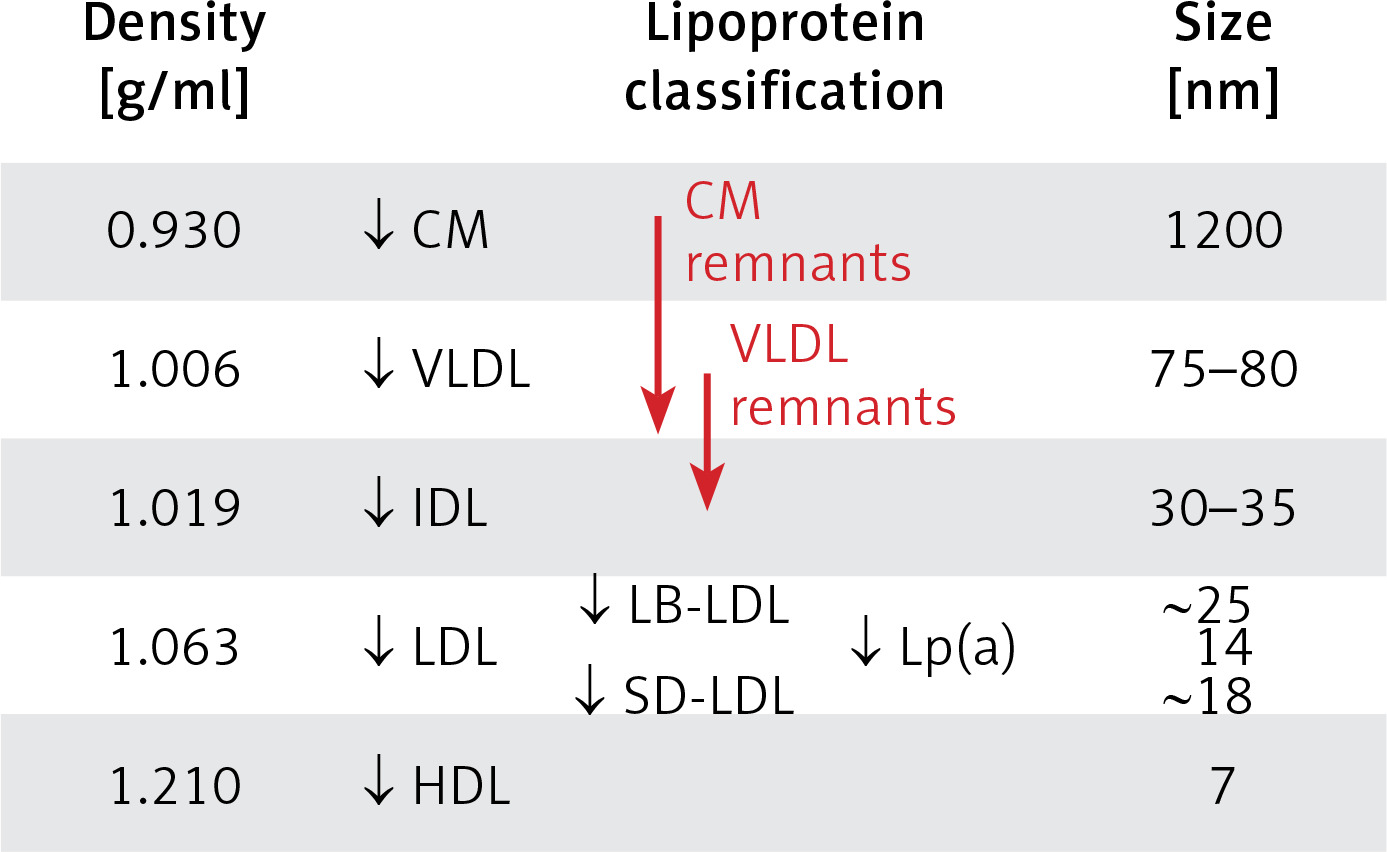
TRL metabolism involves lipolysis of TG contained in CM and VLDL particles, catalysed by circulating and tissue lipoprotein lipases (LPLs), resulting in a reduction in TG concentrations in the blood. The second process is the exchange of TG and cholesterol esters between TRL and HDL/LDL via the cholesterol esters (CE) transfer protein (CETP). In effect, the resulting TRL remnants have smaller particle sizes, are depleted in TG, and enriched in CE, and are also depleted in apoC-III and enriched in apoE. TRL remnants are a heterogeneous group of lipoproteins, with variable density and particle size (Figure 3).
Figure 3
TRL particle size and density
VLDL remnants are in the IDL (intermediate density lipoprotein) and VLDL density classes, while chylomicron remnants (CM remnants) fall into the CM, VLDL and IDL density classes.
Given the intense development of triglyceride-lowering medicines, it is worth looking at the function of apoC-III, a protein encoded in humans by the APOC3 gene. ApoC-III inhibits lipoprotein lipase and hepatic lipase, creating conditions for inhibition of TRL uptake by the liver. Increased levels of apoC-III induce the development of hypertriglyceridemia, and its overexpression contributes to the development of atherosclerosis. Available data also suggest an intracellular role for apoC-III in promoting the assembly and secretion of triglyceride-rich VLDL particles from liver cells in hyperlipidaemia [15].
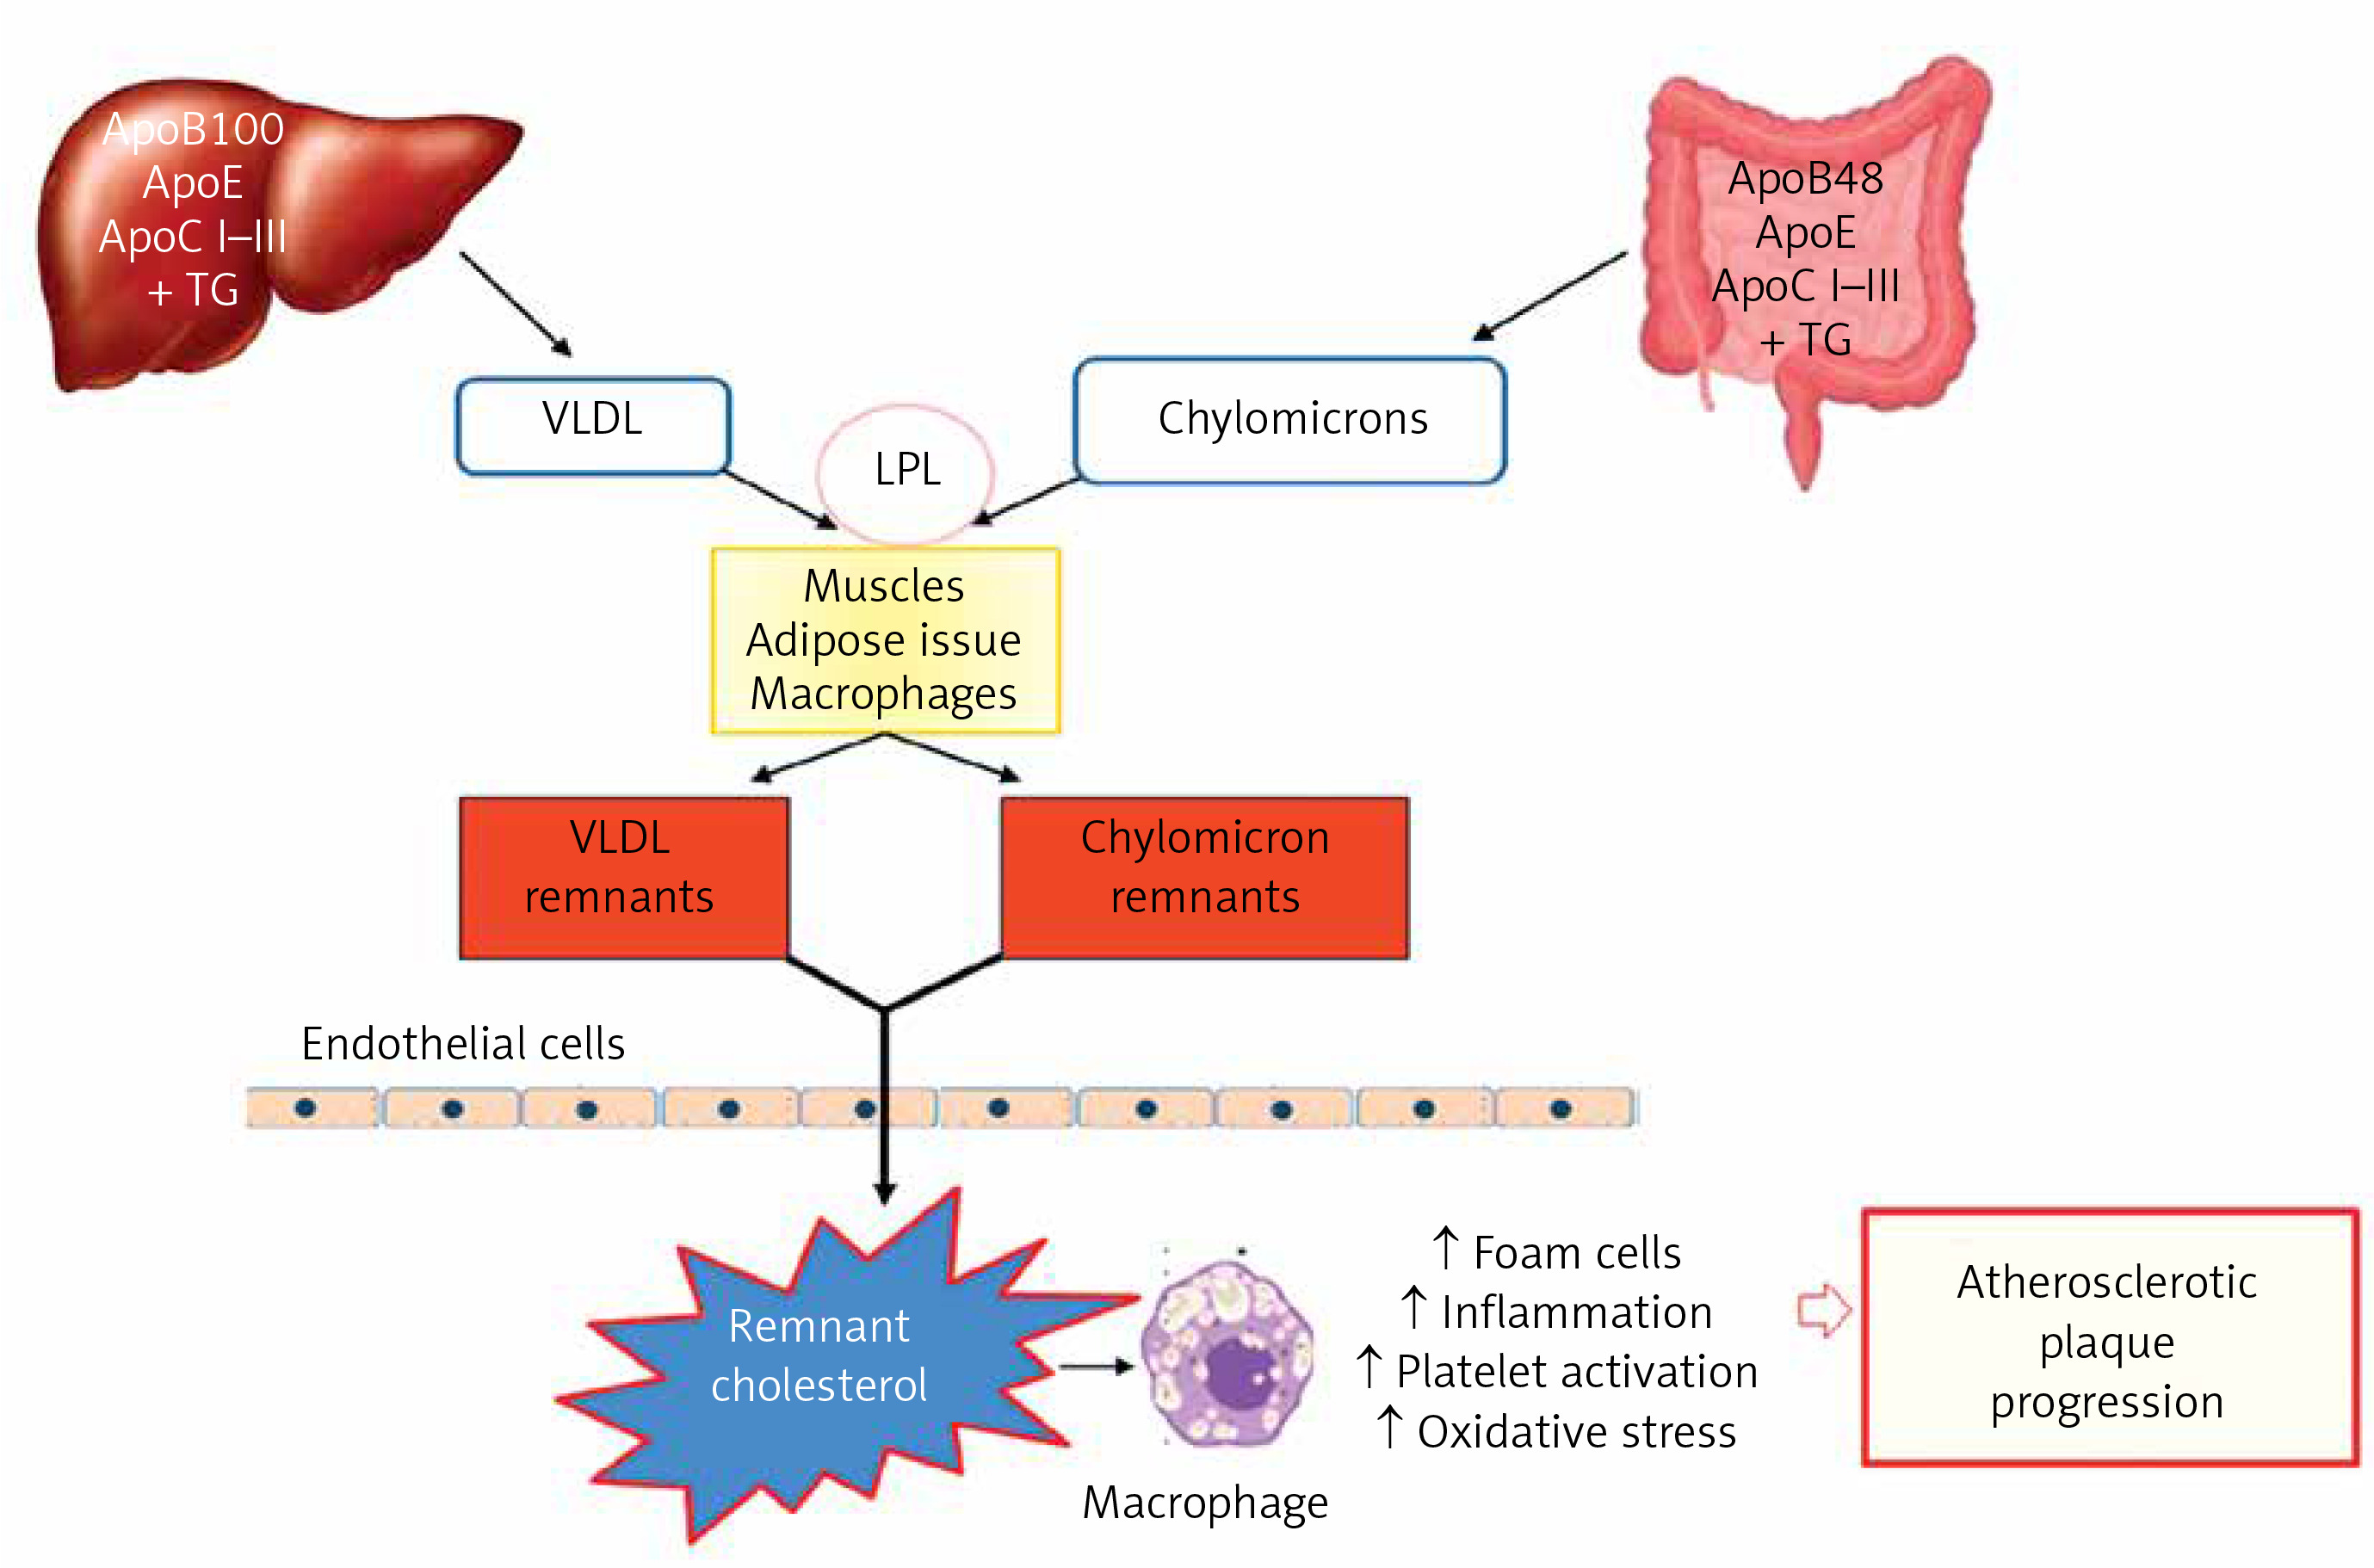
TRL remnant particles are removed from the blood through the uptake pathway by hepatocytes, via the receptor for low-density lipoproteins (LDLR), the LDL receptor-like protein (LRP) and heparan sulphate proteoglycans (HSPG) that bind apoE particles. The clearance of CM remnants is mediated by LRP or HSPG, whereas VLDL remnants are mainly removed via LRP. CM and VLDL remnants compete for the same uptake pathway involving apoE. Individuals with the apoE2 isoform were found to have reduced clearance of TRL remnants.
Smaller, highly modified TRL remnant particles are involved in atherogenesis. This is determined by both their small size and their high content of cholesterol and apoE. Remnant particles readily penetrate the endothelium (transcytosis) into the arterial walls, accumulate in the subendothelial space where they are bound by proteoglycans and are readily, without prior modification, taken up by LDLR-mediated macrophages with foam cell formation. FFA, released from local lipolysis, induce inflammation, platelet activation and oxidative stress, leading, in addition to endothelial dysfunction, to the initiation and progression of atherosclerotic lesions (Figure 4).
Higher TG levels in blood, correlating with the accumulation of TRL and their remnants, is a cardiovascular risk factor independent of LDL-C levels, referred to as residual [16, 17]. This suggests a different approach to atherogenic dyslipidaemia defined as hypertriglyceridaemia with reduced HDL-C concentrations and increased content of small dense LDL. Hypertriglyceridaemia also increases the risk of cardiovascular disease in individuals with target LDL-C levels (even by more than 30%) [18]. Genome-wide association studies have revealed that susceptibility to ischaemic heart disease is associated with the presence of genes involved in TG metabolism [19]. Similarly, Mendelian randomisation studies indicate a causal relationship between TG metabolism and the risk of atherosclerosis and its complications, including ischaemic heart disease, increased in hypertriglyceridaemia by 33% [20].
Methods of determination
Triglycerides
Triglycerides are determined by enzymatic methods, usually following the release of glycerol by enzymatic or alkaline hydrolysis. Typically, TG in a serum/plasma sample are exposed to LPL, resulting in the release of glycerol and FFA. Subsequently, 3-phosphoglycerol and adenosine-5-diphosphate (ADP) are formed from glycerol with the involvement of glycerol kinase and ATP. In a following reaction, in the presence of glycerol phosphate oxidase from 3-phosphoglycerol and molecular oxygen (O2), dihydroxyacetone phosphate and H2O2 are formed. H2O2 reacts with 4-chlorophenol and 4-aminoantipyrine, forming red-coloured quinoneimine (Trinder reaction) [15]. The intensity of the colour originating from quinoneimine, proportional to TG concentration in the tested material, is measured by spectrophotometry in automated analysers [21, 22].
The total allowable error for TG concentration recommended by the American National Cholesterol Education Program (NCEP) is ±15%, while that adopted by the Centre for Quality Assessment in Laboratory Medicine in Poland (COBJwDL) is ±10%.
TRL remnants/remnant cholesterol
The reference technique for the isolation and determination of lipoproteins i.e. preparative ultracentrifugation, is not used in diagnostic laboratories due to its limited availability, as well as methodological difficulties (CM remnants and VLDL remnants show similar density, charge and particle size to native CM and VLDL). Similarly, nuclear-magnetic resonance (NMR) spectrometry is not yet available in routine diagnostics. A method in development, also requiring ultracentrifugation, is ‘total apoB’ – immunochemical determination of apoB100 and apoB48 in an isolated fraction containing CM, VLDL and their remnants. Electrophoretic methods, although available, are also not used in practice for the determination of TRL remnants.
In the available immunochemical method – immunoseparation – the use of anti-apoA-I and anti-apoB100 antibodies allows for the separation of remnant particles coated with apoE molecules. An indirect approach to determine the content of TRL remnants in plasma is to calculate/test the concentration of remnant cholesterol (RC), considered an indicator of the concentration of complete particles of these lipoproteins. Plasma RC concentrations are widely used in epidemiological and clinical studies of the association of TRL remnants with atherogenesis and cardiovascular risk, while their clinical relevance, in the absence of measurements and cut-off points for normal values, is still very limited. It seems, however, that the inclusion of RC in the lipid profile should be expected. RC, just like HDL-C and LDL-C, is determined using direct, homogeneous methods with surfactants, blocking substances and enzymes.
The RC concentration can be calculated using the following formulas:
According to EAS (2019) and EFLM (2016), LDL-C concentrations determined by the homogeneous method should be used in these calculations. Most of the available data indicate a level of ≥ 25 mg/dl (≥ 0.6 mmol/l) as the cut-off point, above which the risk of cardiovascular incidents increases significantly (33% increase in the risk of myocardial infarction); others point to a cut-off point at 30–40 mg/dl (0.75–1.0 mmol/l) [23–25].
Reporting of results
Alongside the TG serum level, a laboratory report should include information on desirable (target) values with regard to cardiovascular risk and alarm values, indicating severe dyslipidaemia (Table I).
Table I
In the EAS position statement (2021), a plasma/serum TG level of < 100 mg/dl (1.1 mmol/l) was defined as optimal. Higher levels, associated with accumulation of TRL and their remnants and a significant risk of ASCVD dependent on them, were considered hypertriglyceridaemia (Table I) [26, 27]. Such a division is also currently recommended by PSLD/PoLA experts (2024).
Recommendations
Increased plasma/serum TG levels are associated with significant cardiovascular risk dependent, among others, on the accumulation of TRL and their remnants. Moderately increased fasting TG levels > 150 mg/dl (1.7 mmol/l) are an indication for treatment of hypertriglyceridaemia, which should aim for TG levels < 100 mg/dl (1.1 mmol/l).
Total cholesterol
Cholesterol is one of the best-known lipids, which results, among others, from its direct connection with the development of atherosclerosis. Cholesterol in the body comes from the diet, as well as biosynthesis occurring in the majority of cells, primarily in hepatocytes and enterocytes.
In the blood, it is transported primarily in LDL, and only about 30% of its circulating pool is found in HDL, VLDL, CM and VLDL remnants. Thus, determination of the TC concentration indirectly reflects an approximate plasma LDL level. From a clinical point of view, the TC level is currently used only to assess the severity of hypercholesterolaemia, in the absence of an LDL-C measurement result, and to calculate LDL-C and non-HDL-C concentrations [1, 28]. In cardiovascular risk, stratification scales such as SCORE2, SCORE2-OP, SCORE2-Diabetes TC has recently been replaced by non-HDL-C [29, 30].
Methods of determination
The reference method for the determination of cholesterol is the long-established Abbel-Kendall method, a modification of the Liebermann-Burchard chemical method, based on the reaction of cholesterol with sulphuric acid [31, 32]. In medical diagnostic laboratory practice, the serum/plasma TC level is determined employing enzymatic methods and using automated analysers. In a typical method, after enzymatic hydrolysis of cholesterol esters by cholesterol esterase, cholesterol is oxidised by cholesterol oxidase to △4-cholestenone, with the formation of hydrogen peroxide (H2O2) reactive with 4-aminophenazone and 4-chlorophenol with the involvement of peroxidase, forming a red product (Trinder reaction), the concentration of which is determined by spectrophotometry [21, 33]. The total allowable error for TC determination, recommended by NCEP, is ±9% while the one used by COBJwDL is ±8% and this value is also recommended by PSLD/PoLA (2024).
Reporting of results
Alongside the TC level, a laboratory report should include information on the desirable (target) values with regard to cardiovascular risk (Table II).
HDL cholesterol
High density lipoproteins (HDL), unlike other lipoproteins, are characterised by a low lipid and high protein content. HDL transport about 25% of the cholesterol present in the blood, and its content in the particles of these lipoproteins varies considerably. Therefore, plasma HDL-C level provides indirect and inaccurate information on HDL content in the blood. Nevertheless, HDL-C measurement remains a basic test for the assessment of HDL content in the blood, as methods of direct measurement of the number of HDL particles (HDL-P), and their individual subfraction (measured with e.g. nuclear magnetic resonance spectrometry, ion mobility spectrometry, electro-phoretic techniques) are not available in routine laboratory diagnostics and do not provide sufficient new data to be recommended. It appears that the best method (not available in practice) to assess HDL functionalities is to assess their cholesterol efflux capacity (CEC). This is an in vitro test that measures the ability of HDL to promote cholesterol removal from cholesterol donor cells such as macrophages. CEC is a predictor of cardiovascular risk independent of HDL-C concentration [34, 35].
From a practical point of view, HDL-C level is not currently recommended as a treatment target or predictor of cardiovascular risk or for use in monitoring the treatment of lipid disorders [4, 5]. HDL-C level is used in the calculation of LDL-C and non-HDL-C levels.
Methods of determination
The HDL-C level is measured in serum or plasma. Previously used methods required ultracentrifugation or, more commonly, precipitation to isolate the HDL fractions. The reference method for the determination of HDL-C was a combination of ultracentrifugation and chemical precipitation to separate HDL from other lipoprotein classes containing apoB [36]. In the late 1990s, direct (homogeneous) assays for the determination of HDL-C were introduced into medical diagnostic laboratories [3]. Direct assay, without precipitation of LDL and VLDL, is possible thanks to the use of a detergent which dissolves HDL and adsorptively blocks access of enzymes (esterase and cholesterol oxidase) to cholesterol in VLDL and LDL particles.
New-generation homogeneous methods (several types) are widely available, and ready-to-use reagents allow full automation of HDL-C measurement in the primary serum/plasma sample [3]. Direct methods are well standardised (for samples from healthy individuals) and ensure sufficient accuracy of measurement. Measurement bias, if any, is mainly due to the matrix effect, e.g. in dyslipidaemia. In measuring the HDL-C level, neither precipitation nor current direct methods differentiate between the HDL subclasses discussed below. According to the NCEP recommendations, the total allowable error for HDL-C direct method measurement is ±13% for normolipidemic samples and between –20% to +36% for dyslipidemic samples. The majority of inaccurate results are seen at HDL-C levels < 40 mg/dl (< 1.0 mmol/l) [36]. In COBJwDL surveys, the applicable error limit is ±15% and this value is also recommended by PSLD/PoLA (2024).
HDL are a heterogeneous group of small discoid and spherical particles, differing in density (1.063–1.21 g/ml), size (7.6–10.6 nm) and electrophoretic mobility, as well as apolipoprotein and lipid content [37, 38]. Apolipoprotein A-I (apoA-I) is the major protein component of the HDL particle, accounting for about 70% of the protein content and playing a significant role in HDL function and biogenesis [39]. HDL can be fractionated using different techniques depending on their physicochemical properties and composition [40] (Figure 5). Two fractions are obtained by sequential ultracentrifugation: HDL2, a fraction of large light particles, rich in lipids, with a density of 1.063–1.125 g/ml, and HDL3, a fraction of small, dense particles, rich in proteins, with a density of 1.125–1.21 g/ml. HDL2 and HDL3 particles are not homogeneous fractions. They can be separated by gradient electrophoresis on a polyacrylamide gel into five subfractions of decreasing size: HDL2b, HDL2a, HDL3a, HDL3b and HDL3c. Using a bidirectional electrophoresis method that allows separation according to charge and particle size, more than 10 HDL subfractions ca be obtained. To standardise nomenclature, it has recently been proposed to divide HDL into 5 subclasses according to their physical and chemical properties [41]: 1) very large HDL, 2) large HDL, 3) medium HDL, 4) small HDL, and very small HDL.
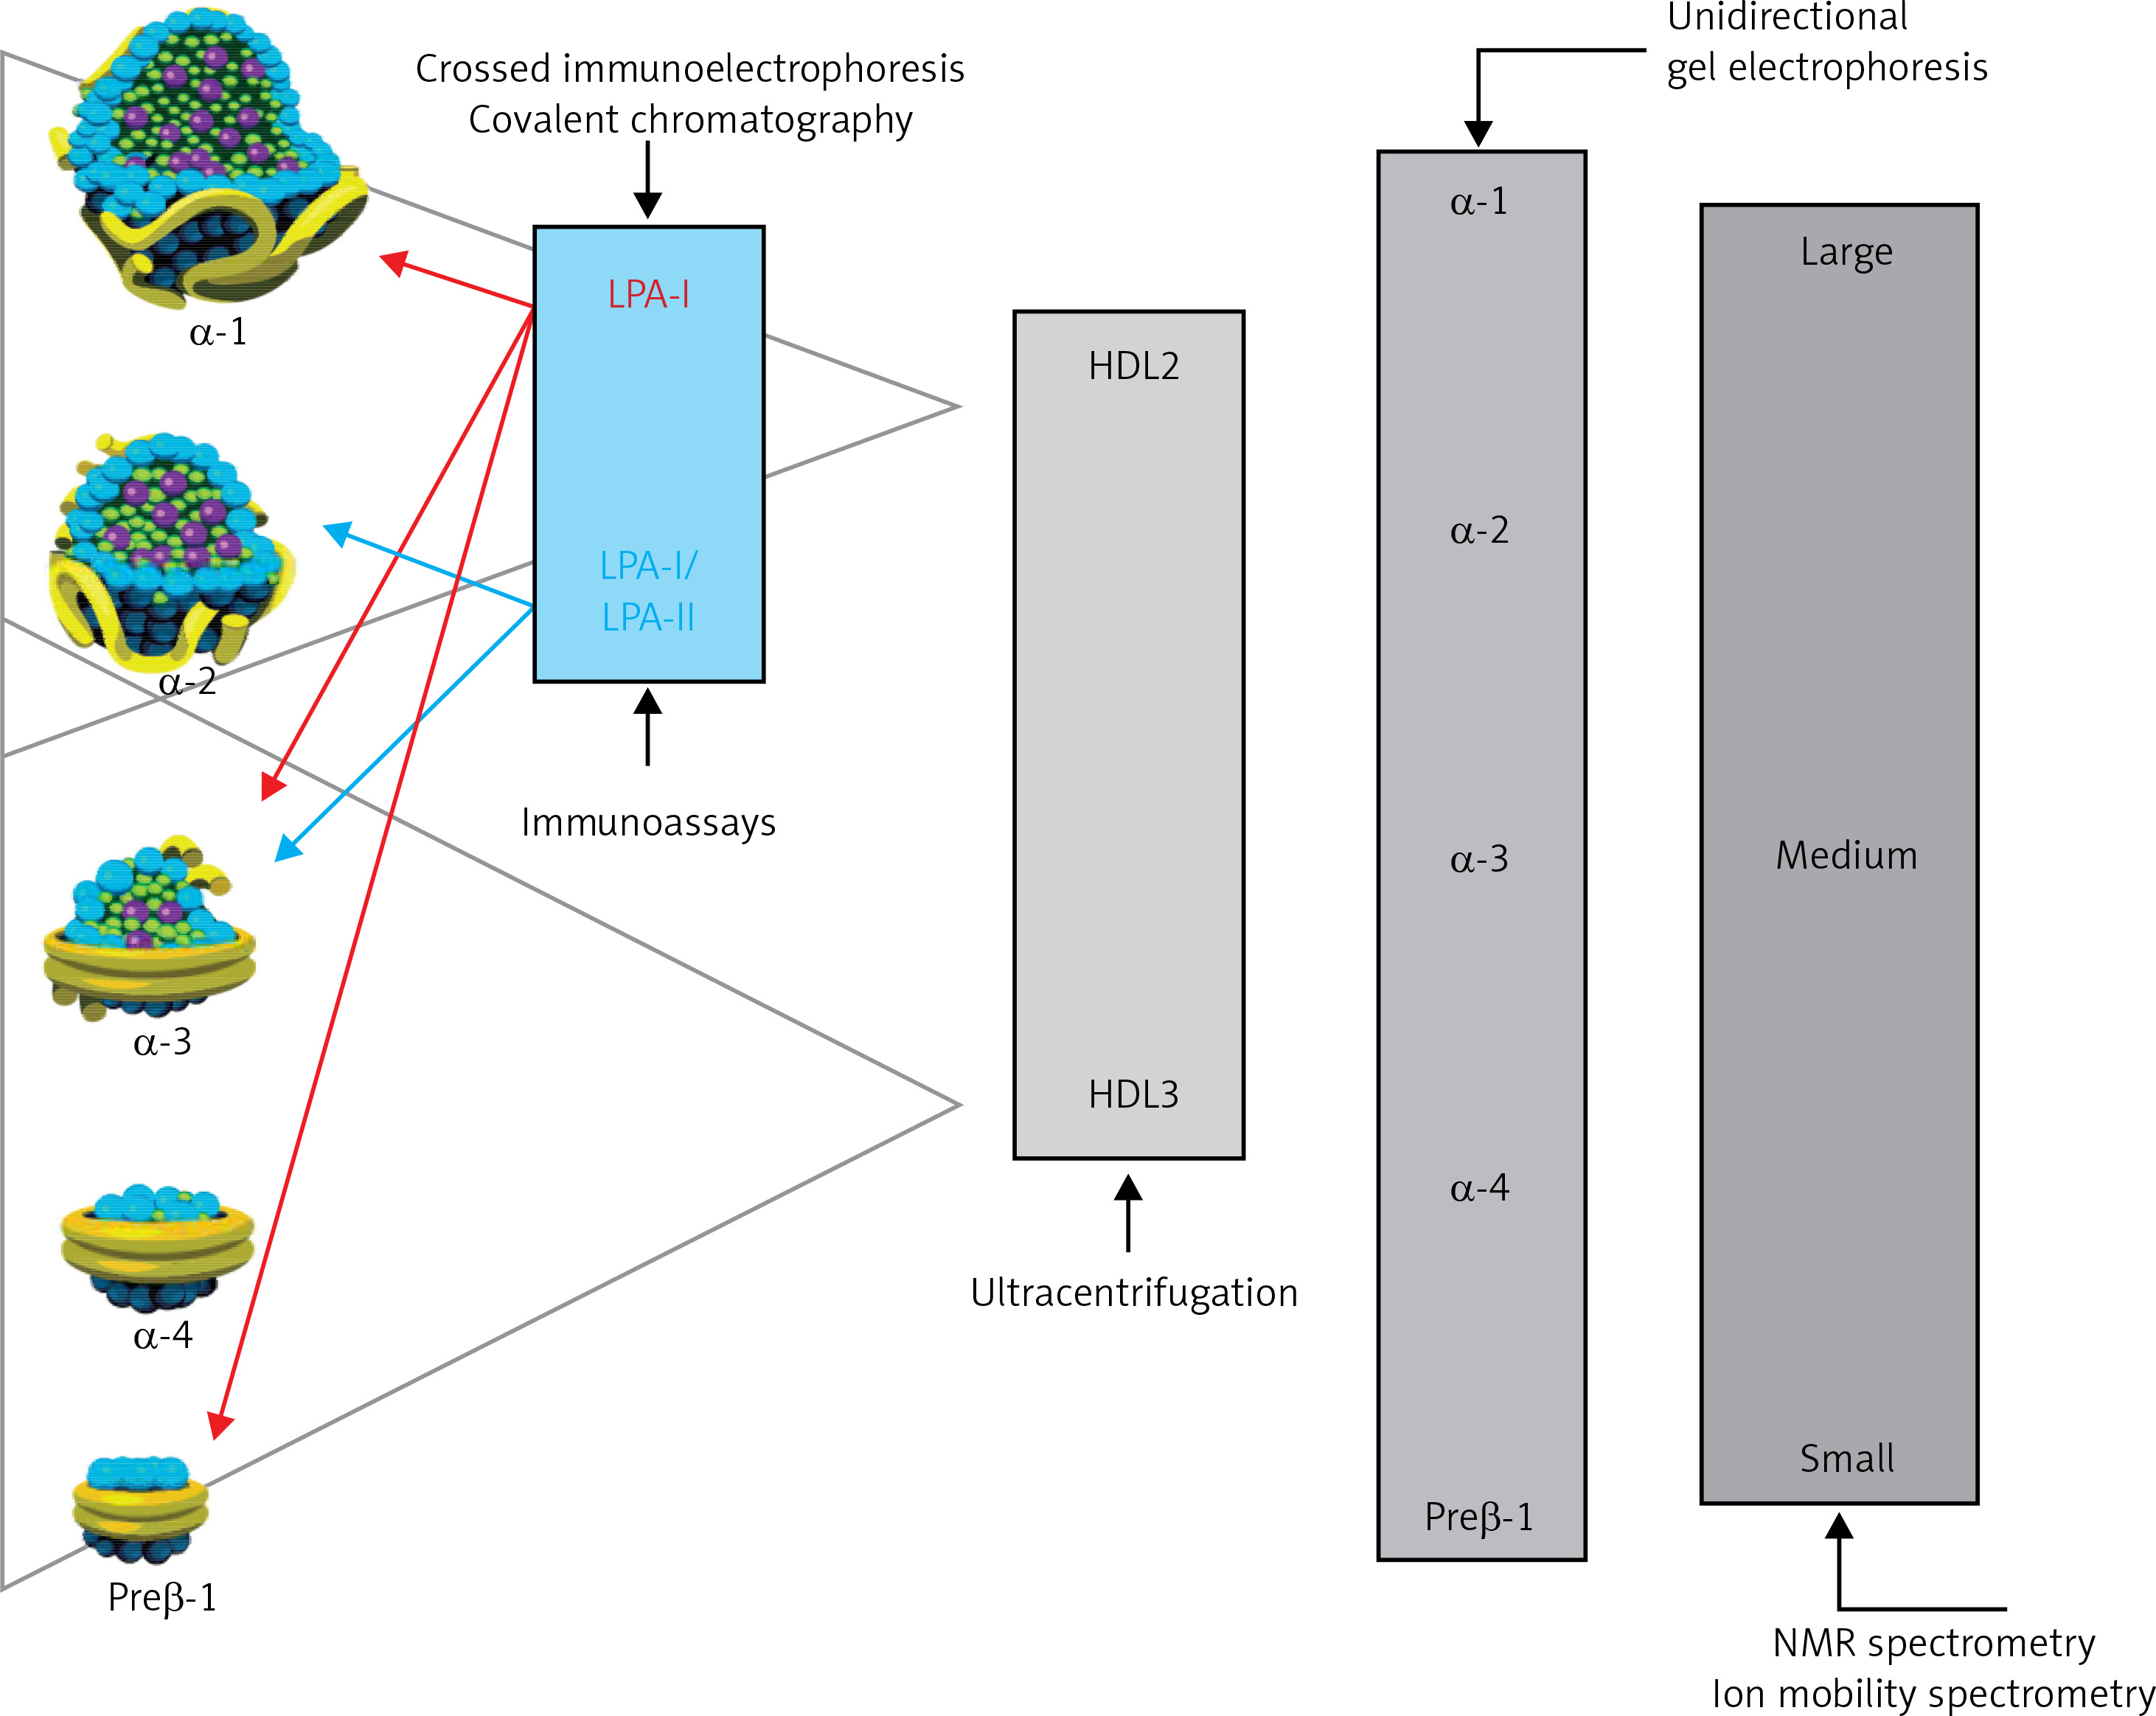
The analytical methods/measurement techniques listed in Figure 5 allow for direct determination of HDL particles in serum/plasma (HDL-P), as well as differentiation of their subfractions, which is made possible by a certain functional characteristic [40, 42]. Due to the different results obtained for the different HDL subfractions with regard to their predictive properties (most studies indicate that small dense HDL is a proatherogenic fraction), they are assessed mainly for research purposes [43–45]. As mentioned above, perhaps research on CEC will change our ability to assess the function of HDL particles.
Recommendations
Currently, the measurement of HDL-P requires standardisation of methods and the definition of desirable (target) values, which makes it impossible to perform these tests routinely.
There is no direct evidence at present of the usefulness of HDL subfraction measurement in cardiovascular risk assessment, and cholesterol efflux capacity (CEC) assessment is not available in clinical practice.
Reporting of results
Alongside the HDL-C level, a laboratory report should include information on desirable (target) values with regard to cardiovascular risk (Table III). As outlined above, the determination of HDL-C is not relevant for monitoring or assessing cardiovascular risk.
Dysfunctional HDL
The anti-atherosclerotic effect of HDL is primarily related to its involvement in reverse cholesterol transport, but also to its anti-inflammatory, antioxidant, anti-apoptotic, anticoagulant, cytoprotective and vasoconstrictive activity. Altered HDL properties, in particular the development of dysfunctional HDL particles, constitute a factor for an increased cardiovascular risk (there has been a worldwide debate for many years whether this is the correct name) [46–49]. It is caused primarily by inflammation, but also by oxidative stress and glycation. Increased expression of myeloperoxidase (MPO, E.C. 1.11.1.7) plays an important role [50]. MPO catalyses the modification of apoA-I and consequently inhibits ABCA1-dependent reverse transport of cholesterol, contributing to foam cell formation and the development of fatty infiltration of a blood vessel (Figure 6 A). Inflammation also induces HDL transformation consisting in the:
Figure 6
Dysfunctional HDL particles: A – HDL modified by myeloperoxidase, B – inflammatory HDL
SAA – serum amyloid A, PON-1 – paraoxonase-1, GPx – glutathione peroxidase, RCT – reverse cholesterol transport, ABCA1 – ATP-binding membrane cassette transporter A1.
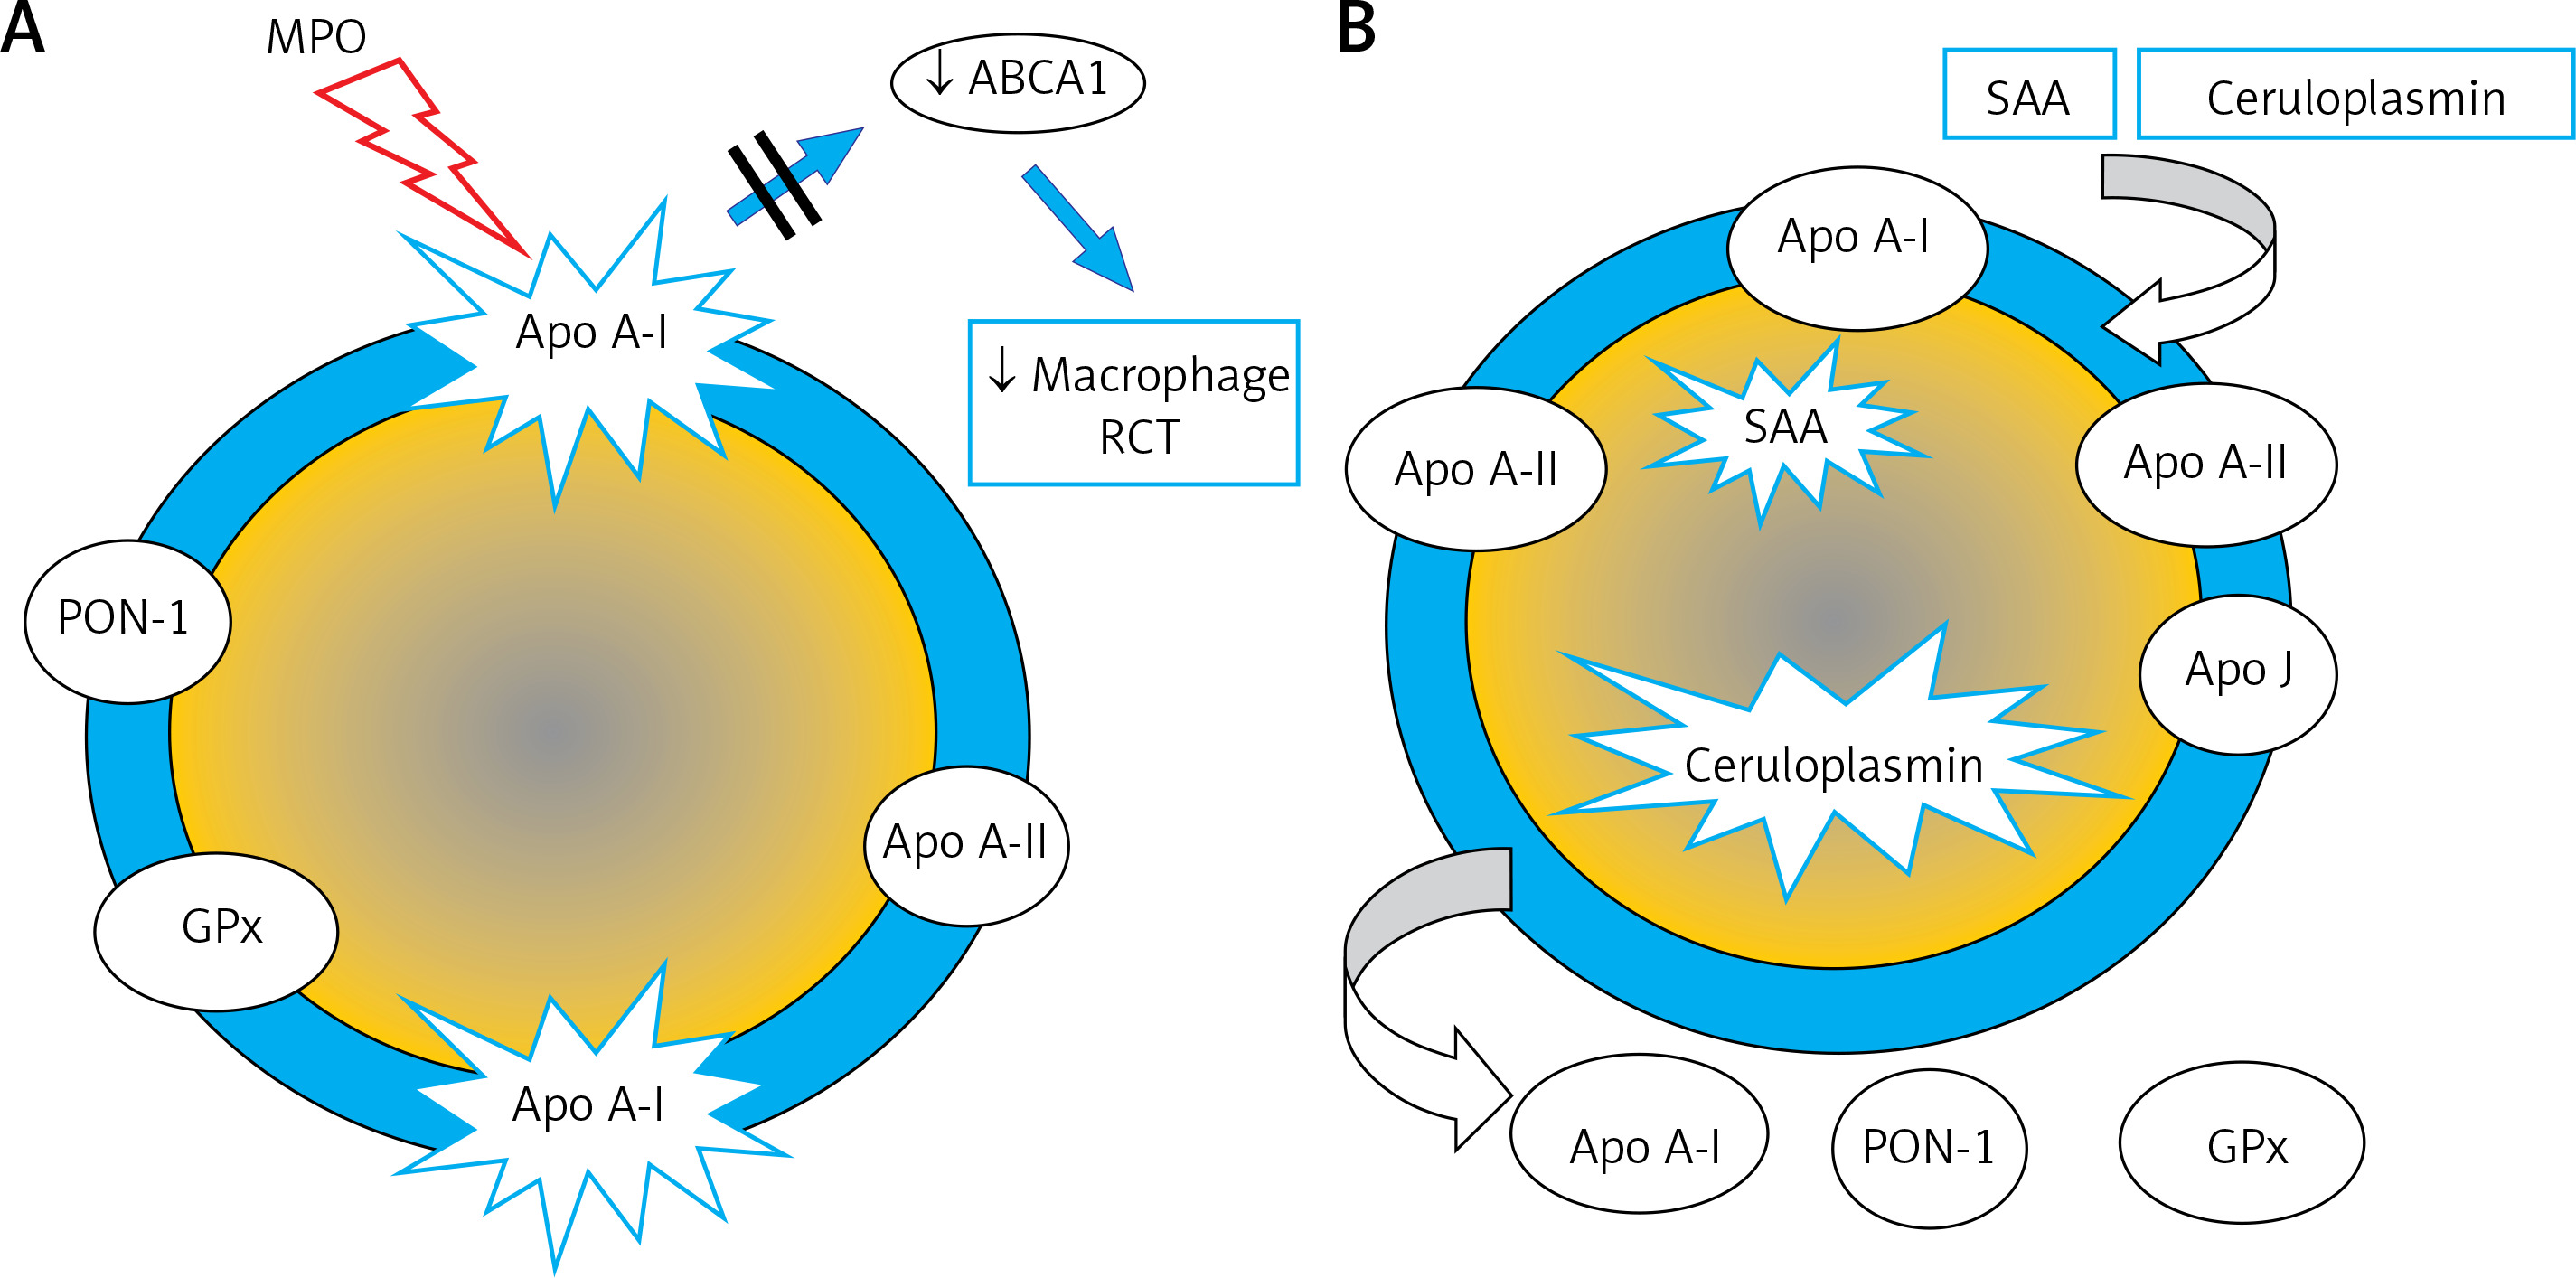
– deficiency/absence of paraoxonase (PON-1) and glutathione peroxidase (GPx), which inhibit LDL oxidation,
– change in the apoA-I/apoA-II ratio,
– presence of acute phase proteins: serum amyloid A (SAA) and ceruloplasmin (Figure 6 B).
PON-1 (aryldialkylphosphatase, E.C. 3.1.8.1) plays a special role in reducing CV risk. It is an enzyme that hydrolyses toxic organophosphorus compounds, phospholipid peroxides and cholesterol ester hydroperoxides [51]. The role of PON-1 is to protect the LDL fraction from oxidative modification, preventing the formation of atherogenic oxidised LDL particles (oxLDL) [52, 53].
HDL-C level does not provide information on HDL functionality. To date, methods for the direct determination of dysfunctional HDL have not been developed for routine use. Knowing the mechanisms of their formation, it is possible to try to predict this process in inflammation diagnosed and monitored using standard markers: C-reactive protein (CRP) and interleukin 6 (IL-6), as well as MPO and PON-1, which are directly related to the dysfunctionality of these lipoproteins. From a practical point of view, in the absence of a gold standard (reproducible, simple, and cheap) for assessment of HDL functionality, determination of dysfunctional HDLs has no clinical relevance. On the other hand, knowledge of this topic is crucial, because already in primary prevention in obese patients, in smokers, or in secondary prevention and/or in chronic kidney disease – the majority of HDL particles may be dysfunctional or even reveal similar atherogenic properties as LDL particles. Such a situation can be observed in patients with high HDL-C levels (> 100 mg/dl/2.6 mmol/l), which not only does not reduce, but even increases the risk of cardiovascular death, irrespective of the cause or risk of cancer [54–56]. The explanation may be precisely that most HDL particles in these individuals have impaired function (are dysfunctional).
LDL cholesterol
Low-density lipoproteins (LDL) transport approximately 70% of the cholesterol present in the blood. Cholesterol and its esters account for 40–50% of the LDL particle mass. Due to the crucial role of LDL in atherogenesis, the LDL-C level, which indirectly reflects the LDL content in the blood, serves as a primary lipid cardiovascular risk factor and its specific values represent a goal for lipid-lowering therapy. In view of the low detectability of hypercholesterolemia in Poland (only 2/10 people know their cholesterol level, and only one in five is on a therapeutic target [57, 58]), lipid profile testing, including LDL-C level measurement, should be promoted. As blood samples for lipid profile do not need to be collected while fasting, the testing is more widely available and calculation/determination of the LDL-C level is easier [2–4, 10].
Methods of determination/calculation
Beta quantification based on preparative ultracentrifugation of the material (serum, plasma), separating lipoproteins into two fractions according to their density, whereby: CM and VLDL (discarded), and LDL, HDL, IDL and Lp(a), is the reference method for determining the LDL-C level. The LDL-C and Lp(a) cholesterol levels are determined in this fraction. In everyday practice, the LDL-C level is usually calculated, and less frequently determined by direct (homogeneous) methods.
The Friedewald formula, using determined TC, HDL-C and TG levels and the adopted TG-to- VLDL-C ratio, is widely used to calculate the LDL-C level [59]:
or
However, this formula should not be used for TG levels > 200 mg/dl (2.3 mmol/l) – the TG-VLDL-C ratio is different from the one adopted in this formula. The calculation of LDL-C concentrations using the Friedewald formula may also be complicated by the presence of IDL and in conditions associated with altered lipoprotein particle composition (obesity, type 2 diabetes, metabolic syndrome, kidney diseases, liver diseases). The Friedewald formula, even if the pre-analytical requirements are met, tends to underestimate LDL-C levels at low values < 70 mg/dl (1.8 mmol/l).
One of the recent modifications proposed to Friedewald formula is he Martin-Hopkins equation (2013) [59]:
where: x – is the TG-VLDL-C ratio based on TG and non-HDL-C levels; values are available in special tables or online calculators (https://ldlcalculator.com). This formula has been shown to be more accurate than the Friedewald formula in determining LDL-C concentration at low LDL-C levels and TG between 175 and 400 mg/dl (2.0–4.5 mmol/l), including in non-fasting samples [60–62].
The Sampson-NIH formula proposed in 2020 is based on LDL-C and VLDL-C concentrations determined by beta quantification:
The Sampson-NIH formula allows for an accurate calculation of LDL-C concentrations at low LDL-C values and at very high TG concentrations – up to 800 mg/dl (9.4 mmol/l). The formula is available in the public domain: https://nih.figshare.com/articles/code/Equation_Calculator_for_Low-Density_Lipoprotein_Cholesterol/11903274) and can be easily configured in laboratory information systems or other types of software. The calculated concentration of LDL-C is further affected by the sum of measurement errors, whose results are used in the formulas, hence the independent role of accuracy and precision of TC, HDL-C and TG measurements in these calculations.
Recent findings indicate that the Sampson-NIH and Martin-Hopkins equations give similar results for most patients. However, the Sampson-NIH equation, being based on a reference method and offering greater accuracy for samples with low LDL-C concentrations and in hypertriglyceridemic samples may provide a strong justification for its preferential use. Unfortunately, most clinical laboratories continue to use the Friedewald equation, which is fraught with many flaws and often underestimates results, so there is an urgent need for an improved education on the subject, as well as efforts to implement new formulas [63, 64].
The LDL-C level can be determined using direct (homogeneous) methods. Current third-generation methods involve the use of reagents containing various detergents, surfactants, carbohydrate derivatives or other agents that block or dissolve individual lipoprotein fractions, selectively making LDL-C available for cholesterol esterase and oxidase. These methods allow the use of automated analysers. Due to considerable methodological variability, direct methods for the determination of LDL-C vary in terms of the accuracy (traceability to the reference method) and precision of assays [62]. The total allowable error for the determination/calculation of the LDL-C level recommended by NCEP is ±12% and this value is also recommended by PSLD/PoLA (2024).
Recommendations
In patients with the TG level > 200 mg/dl (2.3 mmol/l), obesity, type 2 diabetes, metabolic syndrome and the LDL-C level < 70 mg/dl (1.8 mmol/l), calculation of non-HDL-C or apoB measurement rather than LDL-C is recommended.
In medical diagnostic laboratories, the Sampson-NIH or Martin-Hopkins formula is now recommended for the calculation of the LDL-C level.
Reporting of results
Alongside the calculated/determined LDL-C level, a laboratory report should include information on the formula used or the use of a direct determination method as well as the desirable (target) values with regard to cardiovascular risk (Table IV) and alarming values indicating severe dyslipidemia (Table V).
Table IV
Updated (2024) cardiovascular risk categories according to the PoLA/CFPiP/PCS/PSLD/PDS/PSH 2021 guidelines. The level of risk is defined by the presence of at least one of the factors listed in individual categories
| Extreme | Patient in primary prevention with Pol-SCORE > 20%/SCORE2 > 25%1; post-acute coronary syndrome (ACS) status and another vascular event in the last 2 years; post-acute coronary syndrome status and the presence of peripheral artery disease or polyvascular disease2 (multilevel atherosclerosis); post-acute coronary syndrome status and concomitant polyvascular disease; post-acute coronary syndrome status and familial hypercholesterolaemia; post-acute coronary syndrome status in a patient with diabetes and at least one additional risk factor (elevated Lp(a) > 50 mg/dl > 125 nmol/l or hsCRP > 3 mg/l or chronic kidney disease [eGFR < 60 ml/min/1.73 m2]) |
| Very high | Cardiovascular disease documented clinically or by imaging examinations; diabetes mellitus with organ damage3 or other major risk factors4,5, early onset type 1 diabetes mellitus lasting > 20 years; chronic kidney disease with eGFR < 30 ml/min/1.73 m2; familial hypercholesterolaemia with cardiovascular disease or another major risk factor5; risk ≥ 10% and ≤ 20% according to Pol-SCORE/very high risk according to SCORE2 or SCORE-2-OP for gender and age |
| High | Significantly elevated single risk factor, especially TC > 310 mg/dl (> 8 mmol/l), LDL-C > 190 mg/dl (> 4.9 mmol/l), or blood pressure ≥ 180/110 mm Hg; familial hypercholesterolaemia without other risk factors; diabetes mellitus without organ damage (regardless of duration)6; chronic kidney disease with eGFR 30–59 ml/min/1.73 m2; risk ≥ 5% and < 10% according to Pol-SCORE /high risk according to SCORE2 or SCORE-2-OP for gender and age |
| Moderate | Risk < 5% according to Pol-SCORE/low and moderate risk according to SCORE2 or SCORE-2-OP for gender and age |
| Low | Risk of < 1% according to Pol-SCORE. |
1 This corresponds to a SCORE2 risk > 25% – e.g. woman aged 65 years, smoking, with a systolic blood pressure of 179 mm Hg and total cholesterol of 230 mg/dl (6 mmol/l) or man aged 60 years smoking, with a systolic blood pressure of 160 mm Hg and total cholesterol of 270 mg/dl (7 mmol/l); estimated LDL-C > 190 mg/dl (4.9 mmol/l);
2 Polyvascular disease (= multilevel atherosclerosis) – the presence of significant atherosclerotic lesions in at least two of the three vascular beds –- coronary vessels, carotid and vertebral arteries and/or peripheral vessels;
3 Organ damage is defined as the presence of microalbuminuria, retinopathy, neuropathy and/or left ventricular myocardial damage;
5 Major risk factors are age ≥ 65 years, hypertension, dyslipidaemia, smoking, obesity; not applicable to type 1 diabetes in young adults (< 35 years of age) with diabetes duration of < 10 years. When assessing renal function, it is recommended to determine albuminuria using the albumin/creatinine ratio (ACR).
Table V
Desirable and alarming LDL-C serum/plasma levels
Non-HDL cholesterol
Non-HDL cholesterol (non-HDL-C) is an integrated indicator of the blood content (mass) of all lipoproteins that, according to current knowledge, are associated with the initiation and progression of atherosclerosis. These include the apoB-containing particles LDL, VLDL, IDL, CM, TRL remnants and Lp(a). Determination of non-HDL-C level is very important for cardiovascular risk assessment and, as of 2021 (Guidelines of PoLA and five other scientific societies [5]), is recommended as a permanent element of the lipid profile because it complements LDL-C by allowing the assessment of residual risk and, based on available studies, is more predictive of cardiovascular risk than LDL-C levels and most often equally predictive as apoB measurement reflecting the number of atherogenic lipoprotein particles [65, 66]. Non-HDL-cholesterol is now also a recommended parameter in the assessment of cardiovascular risk in SCORE2 and SCORE2-OP and, according to recent Polish recommendations, is the basis for the diagnosis of metabolic syndrome [67].
The non-HDL-C level is calculated according to the following formula:
The calculation of non-HDL-C is more reliable than the calculation of LDL-C [66, 68]. Nevertheless, as with the use of other formulas, the accuracy of non-HDL-C calculation depends on the biological and analytical variability of TC and HDL-C concentrations. However, the biological variability of HDL-C levels is much lower than that of other lipid parameters, especially TG. In addition, HDL-C concentrations are much lower than the TC levels, which minimises their effect on changes in calculated non-HDL-C concentrations.
Reporting of results
Alongside the calculated non-HDL-C level, a laboratory report should include information on the desirable (target) values with regard to cardiovascular risk (Table VI).
Table VI
| Cardiovascular risk | Non-HDL-C [mg/dl] | Non-HDL-C [mmol/l] |
|---|---|---|
| Fasting and non-fasting*: | ||
| Extreme | < 70 | < 1.8 |
| Very high | < 85 | < 2.2 |
| High | < 100 | < 2.6 |
| Low & Moderate | < 130 | < 3.4 |
* According to EAS/EFLM (2016), the difference in the cut-off value for moderate cardiovascular risk in the fasting and non-fasting state is minimal, i.e. 145 mg/dl (3.8 mmol/l) vs. 150 mg/dl (3.9 mmol/l) [6], and therefore may be ignored; Unit conversion: [mg/dl] × 0.026 = [mmol/l].
Recommendations
Non-HDL-C is an indicator of cardiovascular risk, particularly recommended in individuals with TG levels > 200 mg/dl (2.3 mmol/l), obesity, type 2 diabetes, metabolic syndrome and low TC and LDL-C levels.
Based on the PoLA Guidelines (2021) it is equivalent to LDL-C cholesterol as a predictor and should be assessed in every patient as a permanent element of the lipid profile.
Apolipoprotein B
Apolipoprotein B (apoB), which is a structural component of all lipoproteins except for HDL, exists in two isoforms: apoB100 (MM 550 kD), synthesised in hepatocytes and present in VLDL, IDL and LDL, and its fragment, apoB48 (MM 265 kD), synthesised in enterocytes and present in CM and their remnants [10, 69].
Methods of determination
Serum/plasma apoB is determined by immuno-turbidimetry and immunonephelometry. The antibodies used in these methods are directed against apoB 100 while some of the methods also involve determination of apoB 48. In fasting blood samples apoB 100 accounts for > 90% of apoB. Due to the very short half-life of VLDL, it is assumed that at the TG level < 200 mg/dl (2.3 mmol/l) almost all apoB molecules determined are LDL components. Since one apoB 100 molecule is found in every LDL particle, the apoB level determined is a measure of the serum/plasma LDL level.
Immunochemical apoB assays are standardised using secondary IFCC/WHO SP3-08 reference material as well as primary reference material – LDL fraction obtained by ultracentrifugation. The total allowable error for determination of the apoB level recommended by NCEP is ±6% and this value is also recommended by PSLD/PoLA (2024).
Because of the high concordance between apoB levels and plasma LDL content, apoB determination is recommended as an alternative to calculating LDL-C, especially in patients with hypertriglyceridaemia, obesity and type 2 diabetes [70]. If available, the test should be performed in any patient with increased cardiovascular risk, as it best stratifies risk and should ultimately become a permanent element of lipid disorder assessment [5].
Reporting of results
Alongside the apoB level, a laboratory report should include information on the desirable (target) values with regard to cardiovascular risk (Table VII).
Table VII
| Level | ApoB [mg/dl] | ApoB [g/l] |
|---|---|---|
| Fasting and non-fasting: | ||
| Extreme | < 55 | 0.55 |
| Very high | < 65 | 0.65 |
| High | < 80 | 0.8 |
| Low & Moderate | < 100 | 1,0 |
Recommendations
Determination of the apoB level may be an alternative to LDL-C measurement, particularly in individuals with TG levels > 200 mg/dl (2.3 mmol/l), obesity, type 2 diabetes, metabolic syndrome, and low TC and LDL-C level.
Calculated ratios (indices) of lipid profile results such as TC/HDL-C, LDL-C/HDL-C and apoB/apoA-I are not clinically significant for cardiovascular risk assessment.
Small dense low-density lipoprotein
Small dense LDL (sdLDL) are a lipoprotein fraction with low density, but more atherogenic properties than the so-called “large buoyant LDL” (lbLDL), due to their small size and significant modification of their particles, mainly by oxidation, and easy penetration through endothelial cells (transcytosis) into the subendothelial space of the arterial membrane, where they are extensively bound by macrophage scavenger receptors and absorbed leading to the formation of foam cells.
Despite the documented role of sdLDL in atherogenesis and the recognition of their increased content (phenotype B) as a feature of atherogenic dyslipidaemia, the role of this lipoprotein fraction as an independent risk factor for ASCVD is still under investigation and debate, and it is not assessed for diagnostic purposes. Determination of sdLDL by lipoprotein subfraction analysis techniques (ultracentrifugation, NMR spectroscopy, etc.) is not available for routine laboratory operations. A new perspective is offered by the homogeneous methods now available for the determination of sdLDL cholesterol (sdLDL-C) and the formulas developed for calculating its concentration. The newly derived equations depend on two components, LDL-C as defined by the Sampson-NIH equation and the factor of interaction between LDL-C and the natural logarithm of the TG level. In 2021, Sampson et al. proposed an equation to assess large buoyant LDL:
in order to calculate the sdLDL-C level on this basis:
Subsequently, based on data from the MESA (Multi-Ethnic Study of Atherosclerosis) study, the authors have showed that in a multivariate analysis, standardising the results against other known ASCVD risk factors, the estimated sdLDL-C level had the strongest association with ASCVD compared with other lipid parameters [71]. Ongoing studies on the diagnostic characteristics of this parameter represent the next step before potentially adding measurements/calculations of sdLDL-C to the lipid profile.
Lipoprotein (a)
The apo(a) molecule is characterised by marked amino acid sequence homology with plasminogen; it contains the protease domain and the so-called Kringle IV and V domains. The molecular mass of Lp(a) shows high interindividual variability, dependent on the number of repeats of the Kringle IV type 2 (KIV-2) domain, which may range from 3 to 40 and is genetically determined by the number of tandem repeats of the genome sequence in the LPA gene. This genetically determined size of the Lp(a) particle is inversely proportional to the rate of its synthesis mainly in the liver and the serum/plasma concentration – particles of a lower mass (lower number of KIV-2 repeats) are present in higher concentrations, while particles of a higher mass (high number of KIV-2 repeats) are present in lower concentrations [10, 72].
Lp(a) level is a risk factor independent of LDL-C for ASCVD, calcified aortic stenosis, peripheral artery disease or ischaemic stroke. In Poland, Lp(a) levels are measured too infrequently and knowledge of them is inadequate. Therefore, every effort should be made to change this as soon as possible, as increased Lp(a) levels occur quite frequently. According to available data, up to 30% of patients with familial hypercholesterolaemia and/or acute coronary syndrome may have Lp(a) concentrations above 125 nmol/l (50 mg/dl), with often desirable LDL-C levels. In addition, there are emerging opportunities to reduce Lp(a) levels pharmacologically using PCSK9 inhibitors, inclisiran, or ultimately medicines dedicated to lowering Lp(a) levels, such as pelacarsen or olpasiran, which will further increase the need for assays [73–75].
Methods of determination
The serum/plasma Lp(a) level is determined mainly by immunoturbidimetry and immunonephelometry. Determinations should preferably be performed using fresh material. Standardisation of these methods is based on the metrological consistency of the calibrators with the original IFCC/WHO reference material. The results obtained using different methods are still insufficiently harmonised, which is thought to result from the effect of the apo(a) molecule size variability on Lp(a) immunoassays. The antibodies used in these methods usually target the repeat portion of the apo(a) molecule, resulting in possible underestimation of the assayed Lp(a) levels of lower molecular weight (lower number of KIV2 repeats in apo(a)) and overestimation of the assayed Lp(a) levels of higher molecular weight (higher number of KIV2 repeats in apo(a)). Methods using antibodies against non-repeat epitopes, such as the KV domain, are free from such interferences [76–80]. Because of the variation in the molecular weight of Lp(a), the results should be expressed in nmol/l (Table VIII) [81], reflecting the number and not the mass of Lp(a) molecules.
Table VIII
Classification of Lp(a) levels according to cardiovascular risk category. Based on PCS/PoLA 2024 recommendations [81]
Reporting of results
Alongside the Lp(a) level, a laboratory report should include information on desirable (target) and alarm values indicating cardiovascular risk (Table VIII).
The LDL cholesterol level is determined or calculated jointly with the Lp(a) cholesterol. Lp(a), especially at high concentrations, may result in overestimation of the calculated/determined LDL-C level. The LDL-C level can be adjusted to the Lp(a) level calculated using the Dahlen modification of the Friedewald formula, based on the assumption that cholesterol accounts for 30% of the Lp(a) particle mass [10, 79]:
Recommendations
It is recommended that Lp(a) level should be measured at least once in every adult’s lifetime. Measurement of Lp(a) should be considered in all patients with premature cardiovascular disease, non-responders to statin therapy, and individuals with a border intermediate/high risk, to ensure better risk stratification1.
It is recommended that re-measurement of Lp(a) be performed using a test that gives the result in nmol/l (reflecting the number of Lp(a) molecules) for better risk stratification. Screening of relatives of people with high Lp(a) levels should be considered1.
In the case of patients with an Lp(a) level determined as part of an extended lipid profile, the LDL-C should be adjusted using Dahlen’s modification.
1Based on the PSC/PoLA 2024 Guidelines [81].
Lipid profile – laboratory report
Lipid profile includes a battery of blood serum or plasma tests and calculations aimed at identification of dyslipidemia as a cardiovascular risk factor, defining the recommendations and treatment monitoring, including:
– total cholesterol (TC) level,
– HDL cholesterol level (HDL-C),
– LDL cholesterol level (LDL-C),
– non-HDL cholesterol level (non-HDL-C),
– triglyceride (TG) level,
– lipoprotein (a) level [Lp(a)] (determined at least once in life – see PCS/PoLA 2024 recommendations [81]),
– apolipoprotein B (apoB) level – as indicated.
In addition to the results of measurements and calculations, a lipid profile laboratory report (Table IX), should include information on how the LDL-C level was determined (calculated/determined), as well as the target (desirable) and alarming levels of the assayed analytes. When severe dyslipidaemia is suspected, it should also include information on the need to seek urgent medical attention if the LDL-C level indicates a possible diagnosis of heterozygous (> 190 mg/dl; 4.9 mmol/l) or homozygous (> 500 mg/dl; 13.0 mmol/l) familial hypercholesterolaemia (FH), if the Lp(a) level > 125 nmol/l (> 50 mg/dl) indicates a high risk of cardiovascular incidents, or the TG level > 880 mg/dl (10.0 mmol/l) indicates, in addition to increased cardiovascular risk, a high risk of acute pancreatitis or, in the case of some typical symptoms, a risk of familial chylomicronaemia syndrome (FCS).
Table IX
Lipid profile – information in a laboratory report
Information provided on a lipid profile order form on whether a patient is overweight/obese and/or suffers from diabetes and whether he/she is receiving a lipid-lowering therapy is helpful in laboratory interpretation and authorisation of obtained results.